Introduction
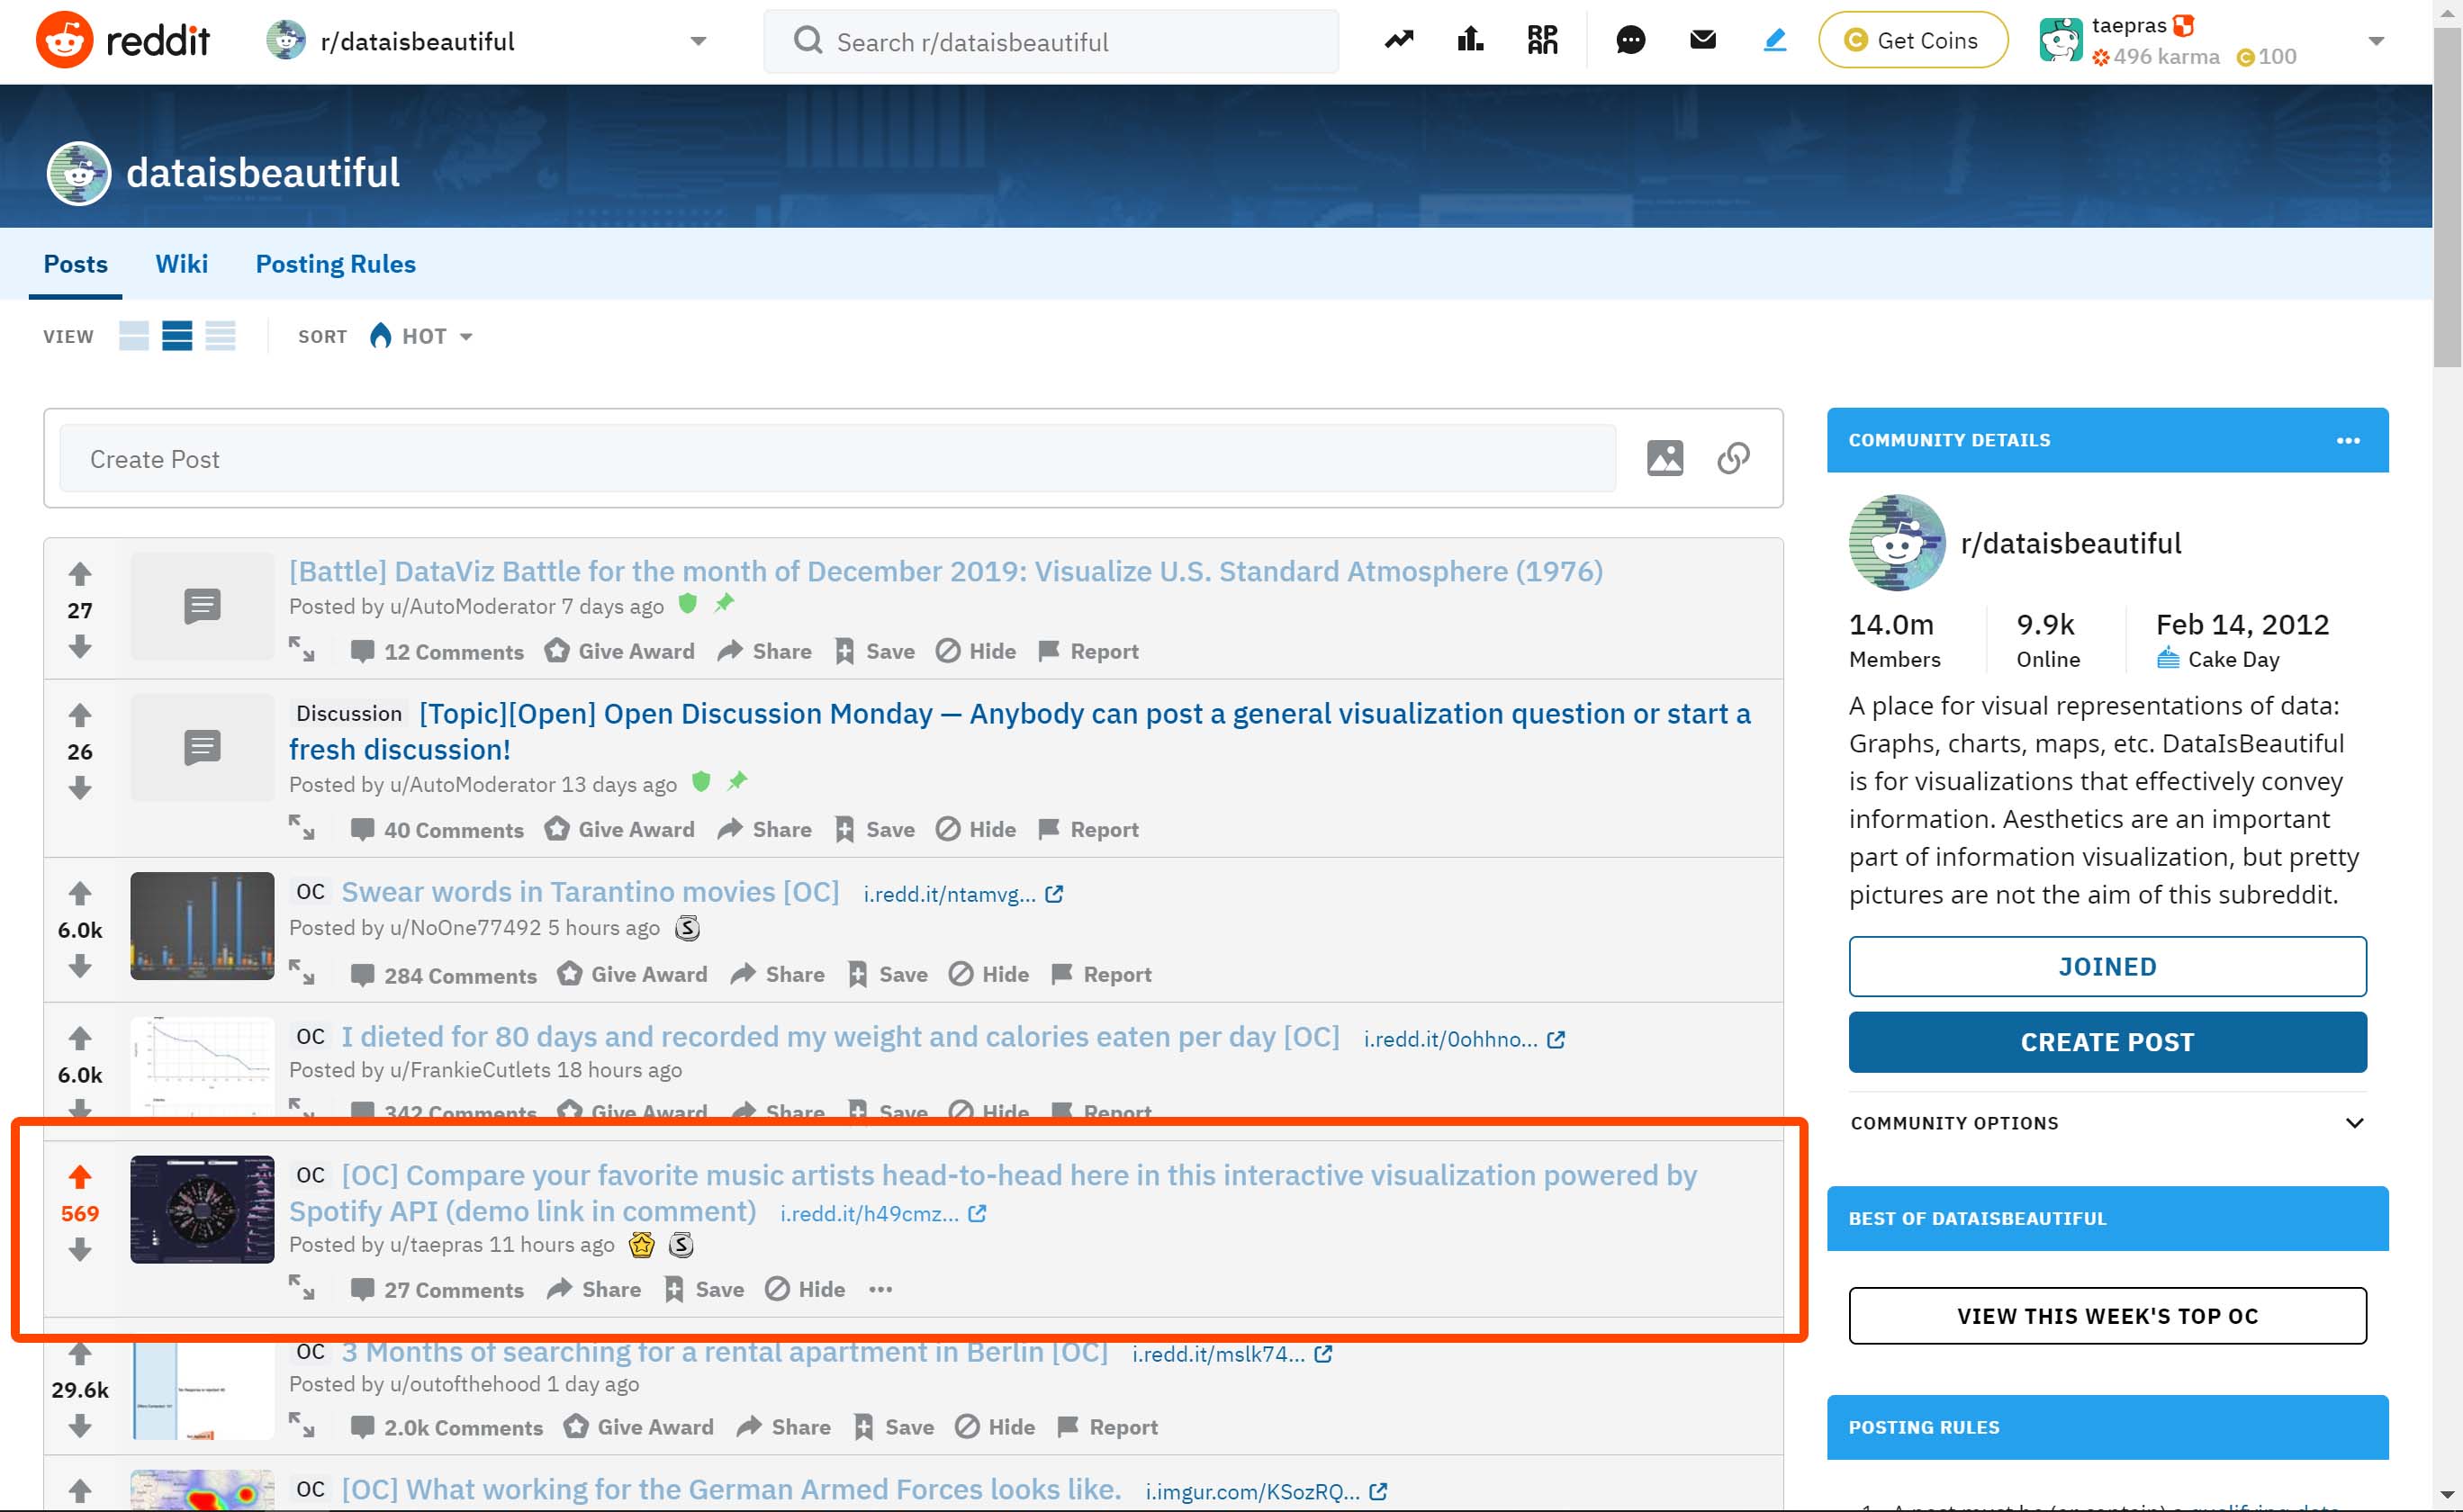
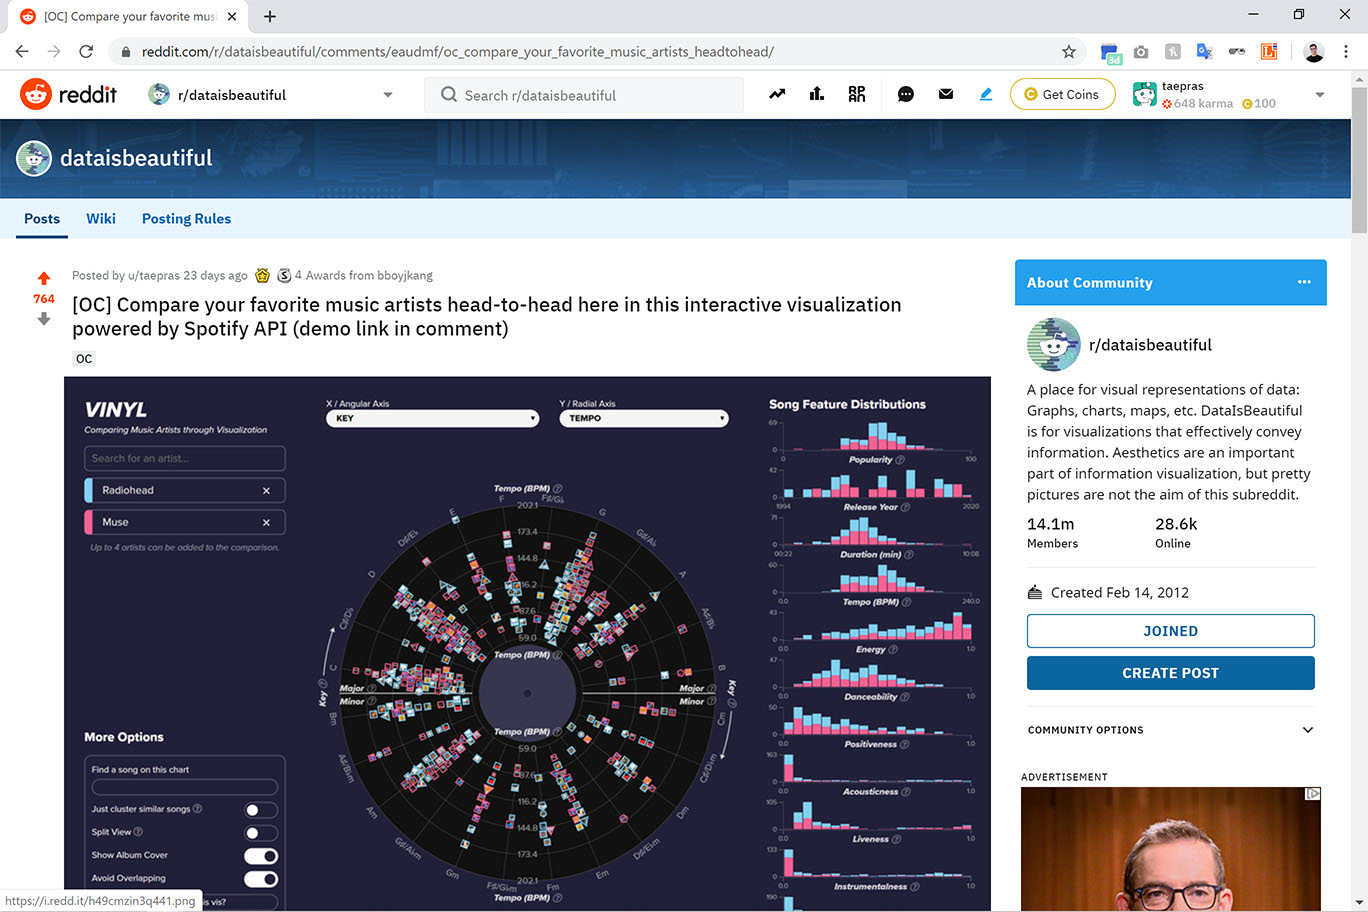
After several months of working on this project, we decided to share it on Reddit in r/dataisbeautiful, a popular subreddit about information visualization with 14 million members.
The morning after, I woke up to find the post voted up high to the first page of the subreddit with several hundred upvotes overnight. With that, our project exploded with around 3,000 users visiting our site in the first two days after launch.
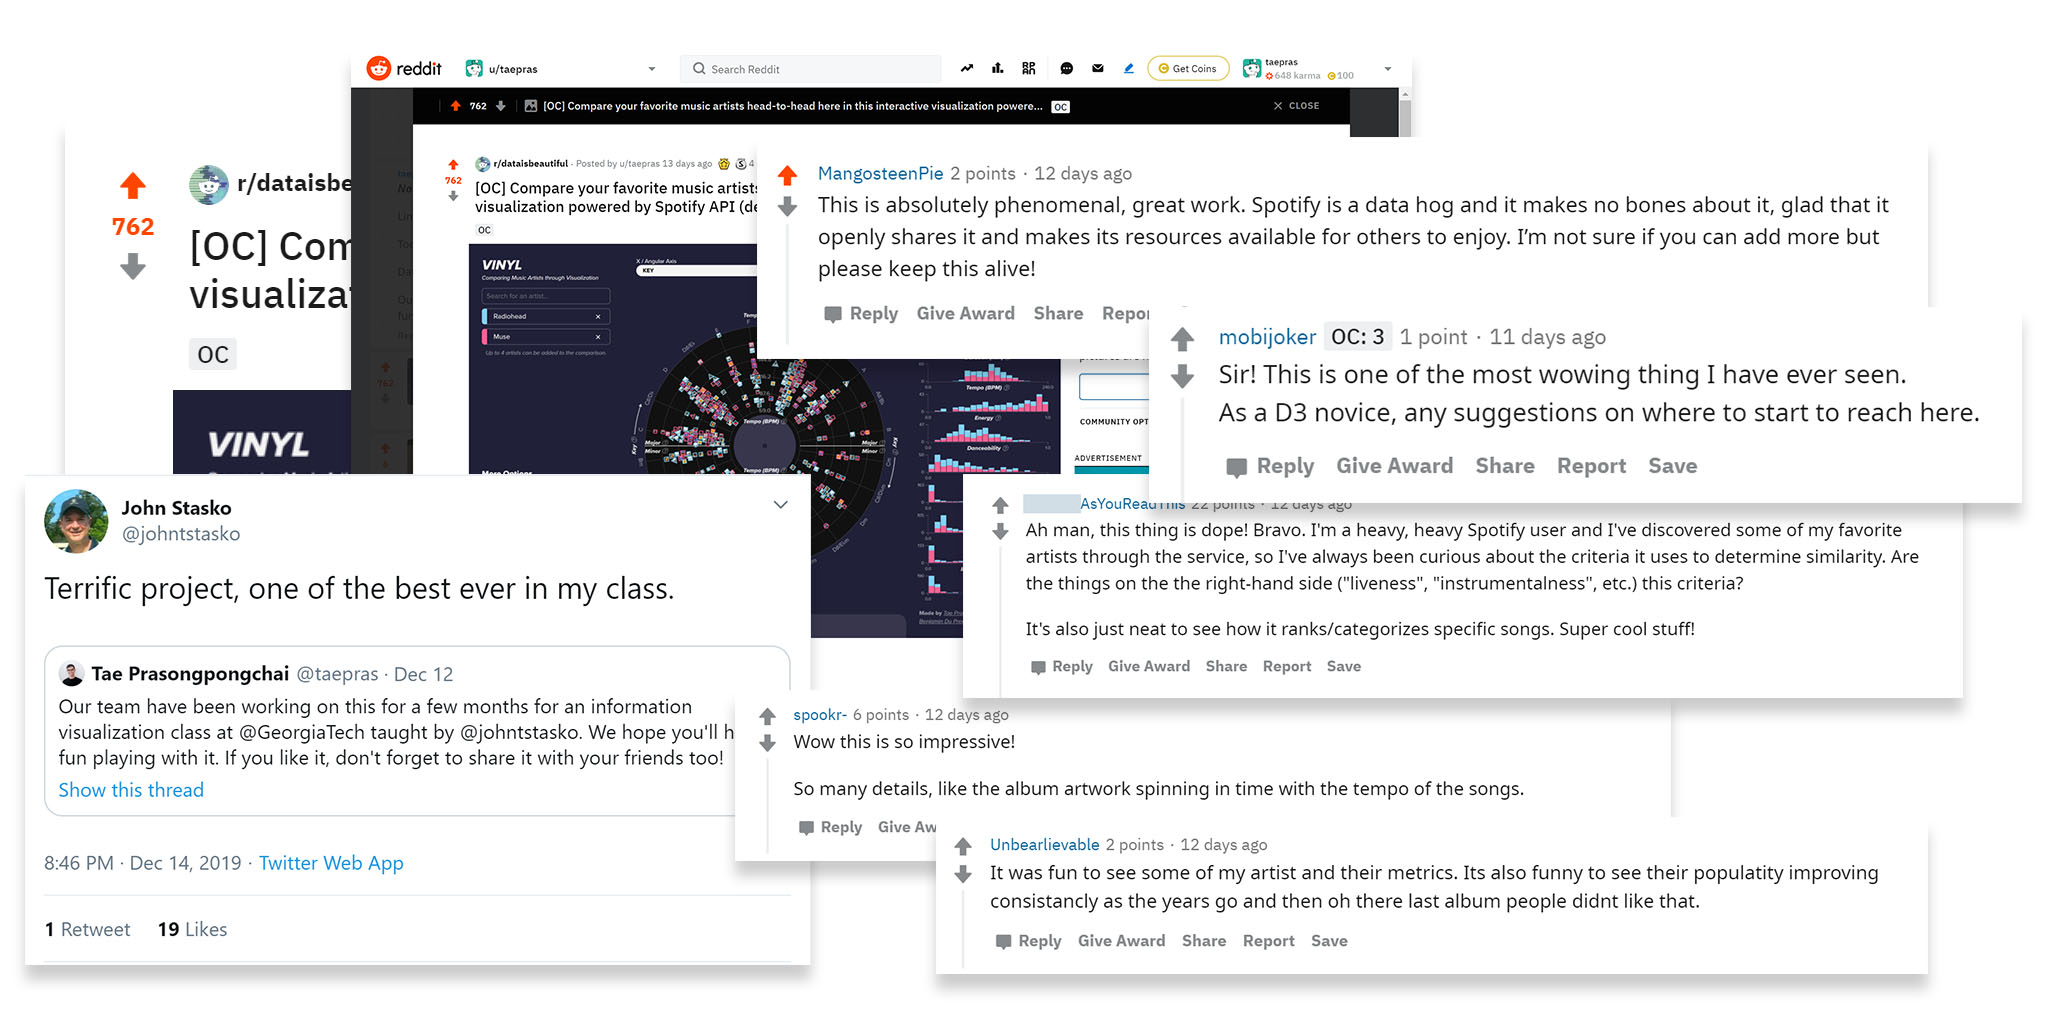
The project also received highly positive comments as well as a shout-out from our professor, Dr. John Stasko, on his Twitter account.
This article will give you the behind-the-scenes look at the design process that got us here.
Overview
Opportunities
It is common for music fans to have discussions—sometimes heated—comparing their favorite music artists against each other.
These debates happen mostly because it is difficult to pinpoint the differences between musical styles due to the inherently auditory nature of music. The large number of songs an artist produces during their career also makes it hard to study them holistically.
Approach & Goals
Thanks to Spotify API, it is now possible to compare songs and artists through numerical attributes. We aim to leverage the API to create a tool for music lovers that
- lets them compare the artists head-to-head, and
- helps them learn more about their favorite music artists' styles,
- sparks conversations about music among friends.
Final Design
Deep dive into your favorite artists' musical styles through data visualization.
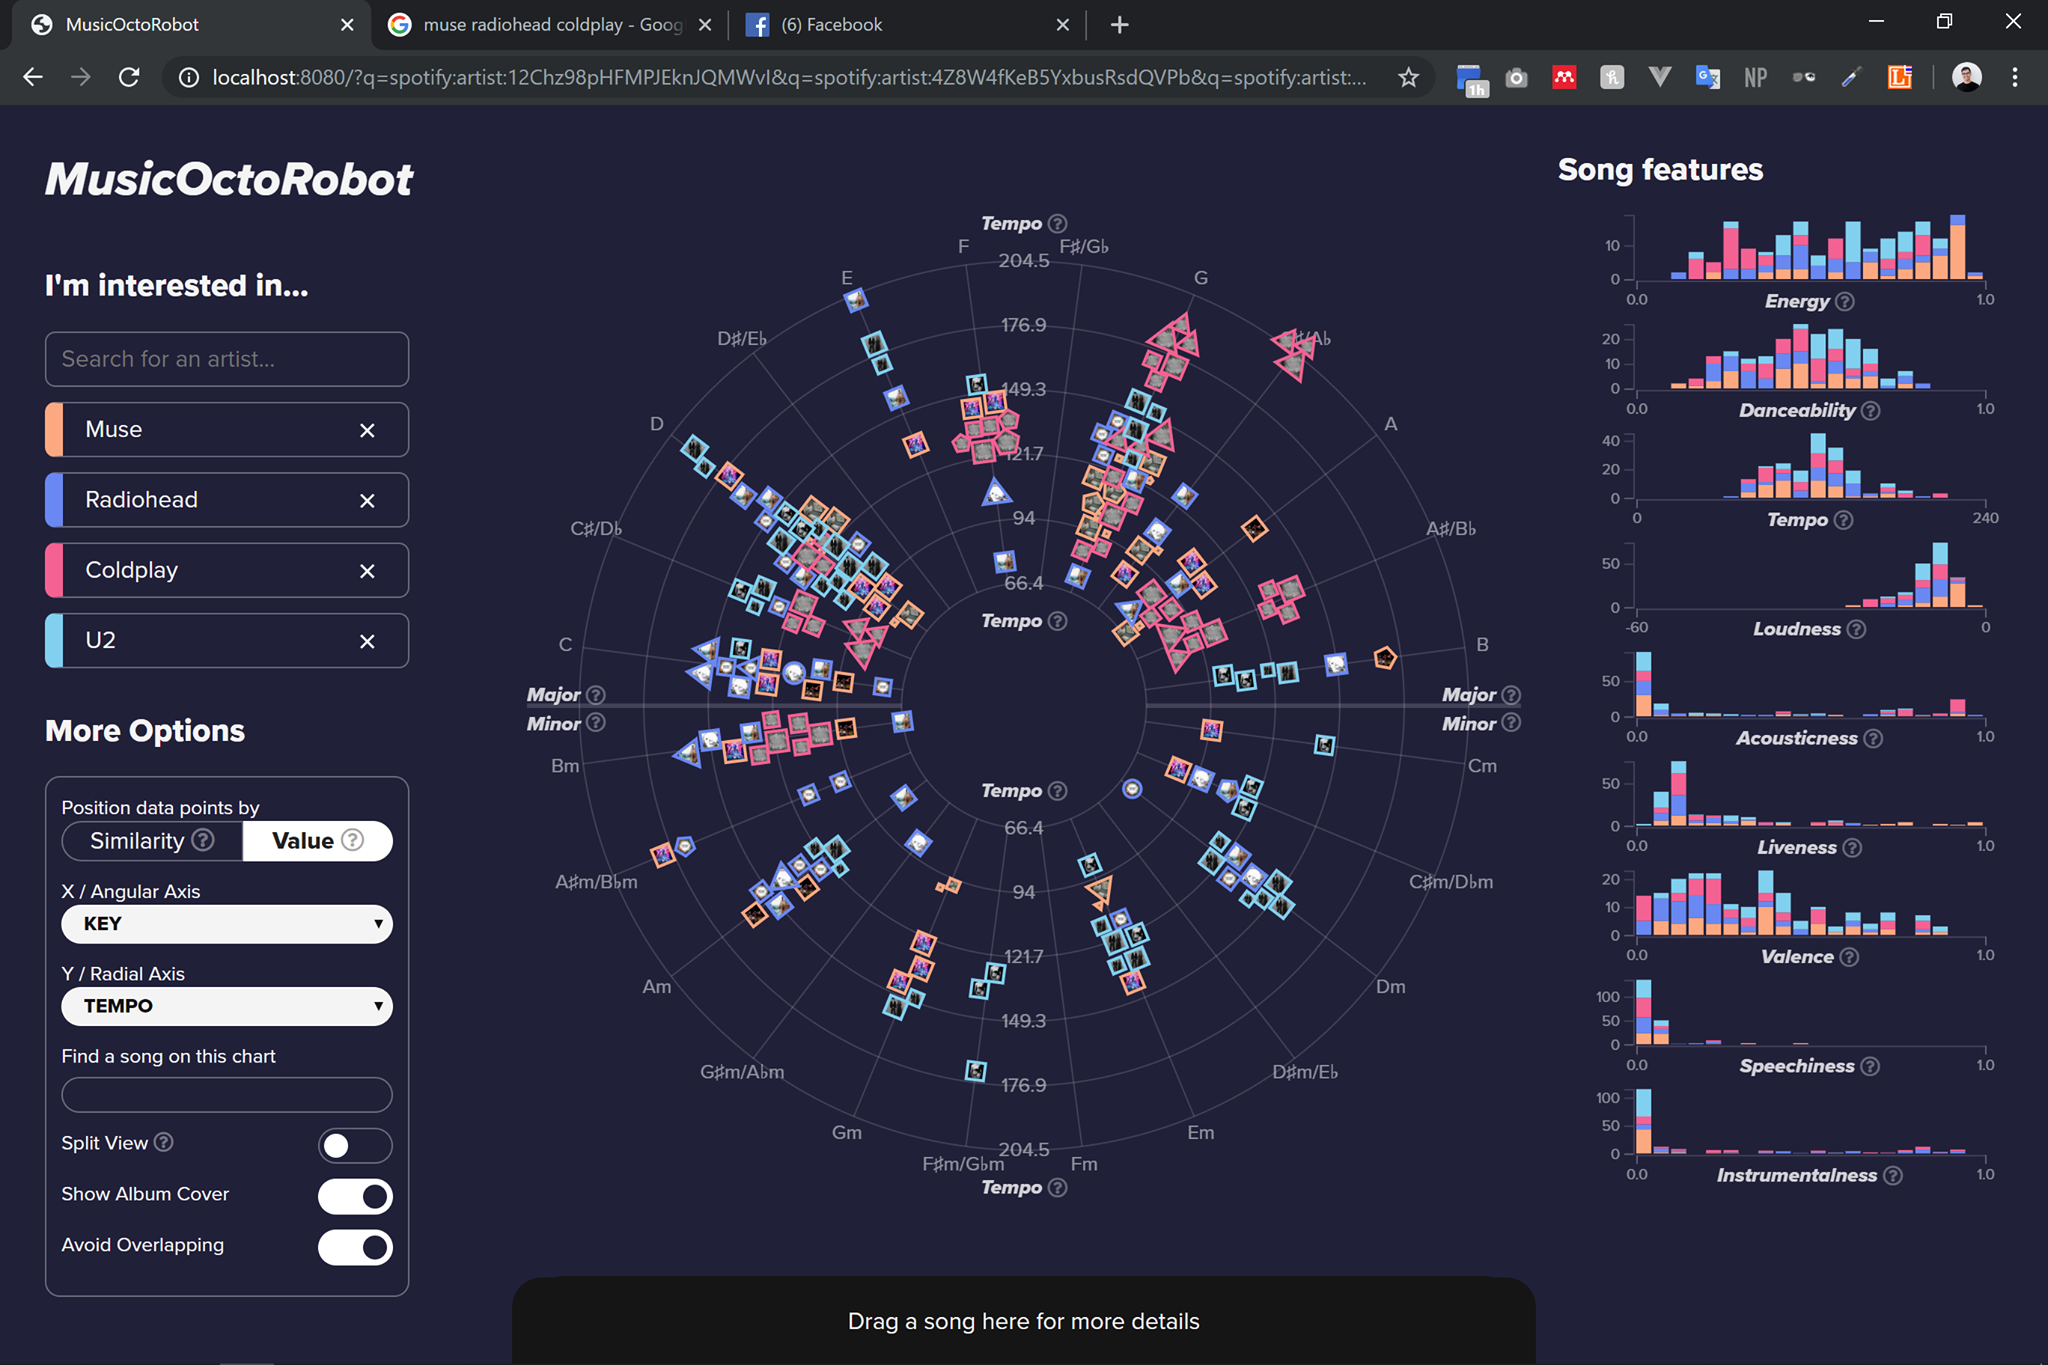
Visualize and Compare Artists' Musical Styles
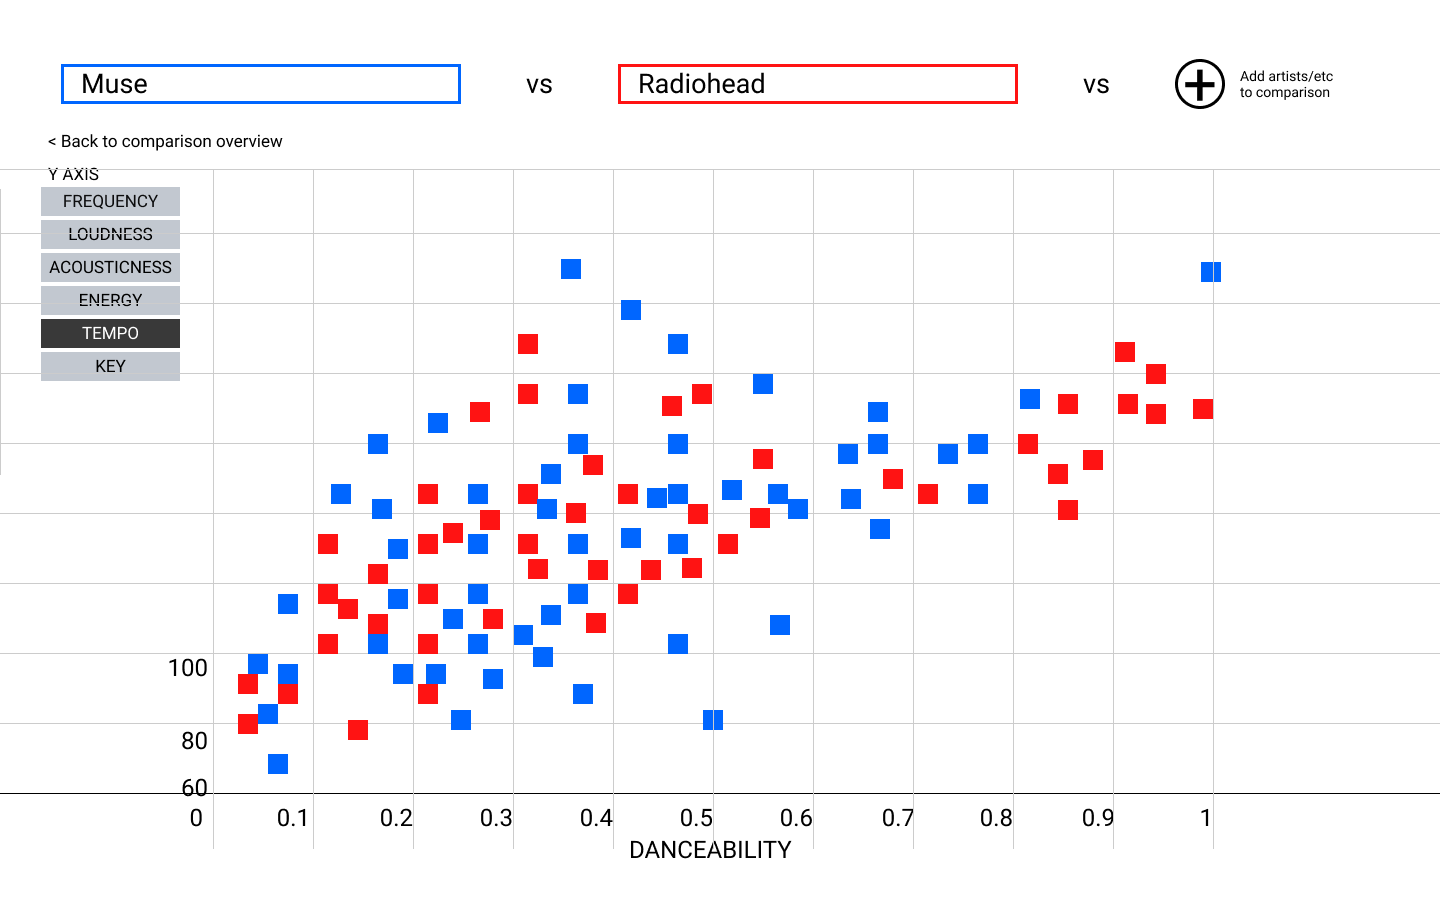
"Muse and Radiohead have been compared against each other a lot. Let's see how they compare."
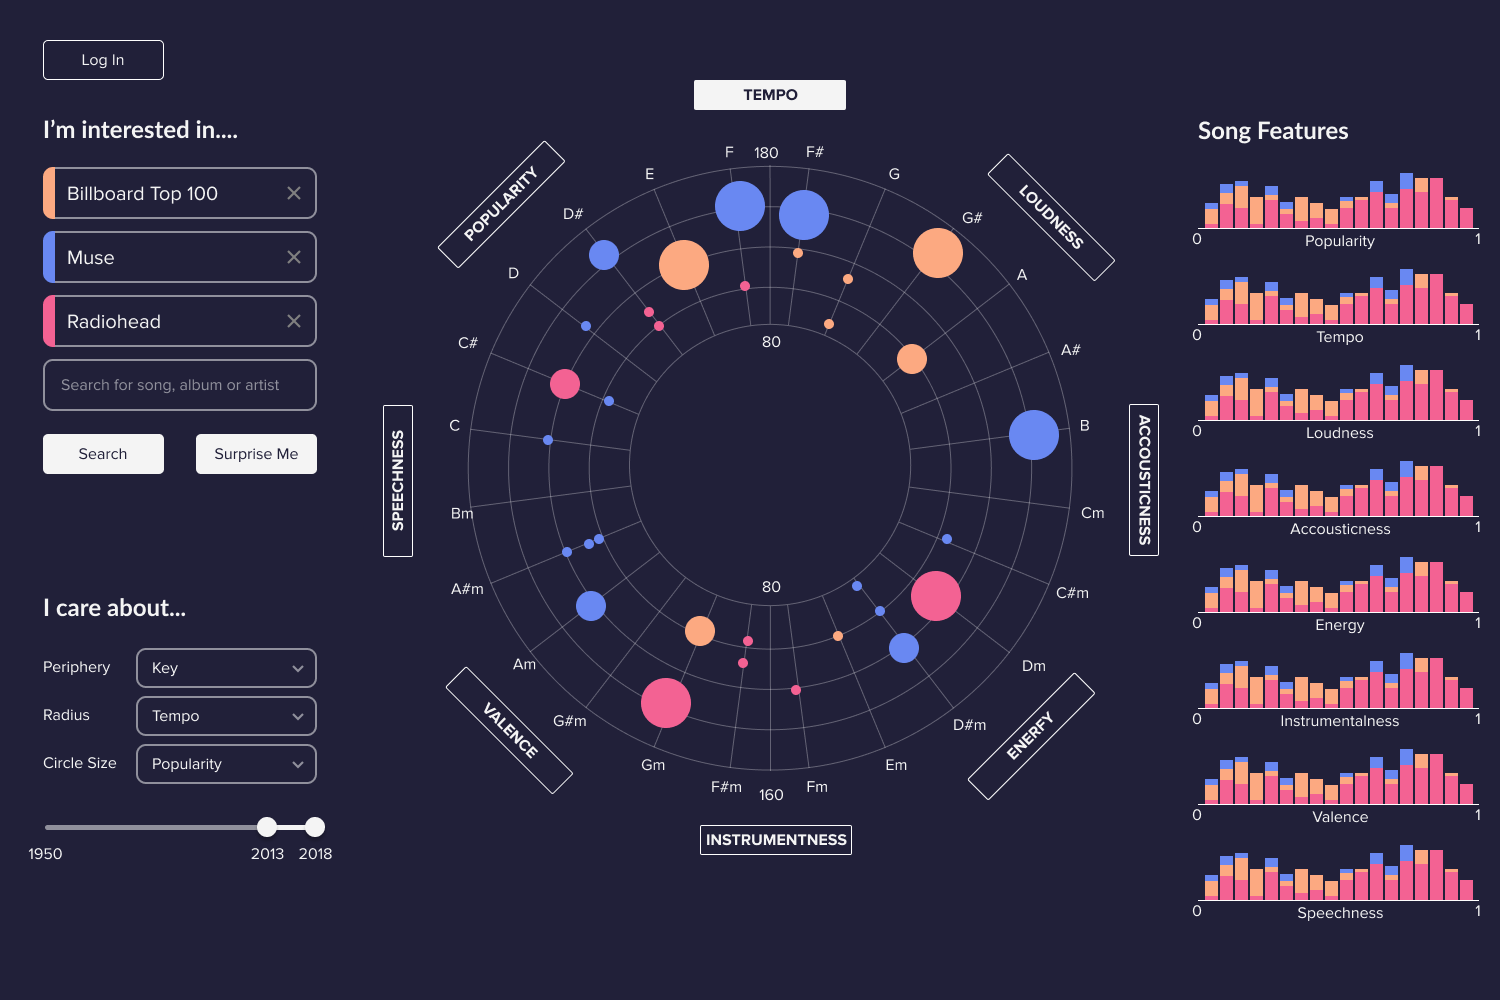
Users can select up to four artists to the comparison from the vast database of artists on Spotify, making Vinyl interesting to broad audiences.
Each song is represented with a shape on the chart, allowing users to explore them holistically.
Learn More About Their Songs
"What's this song over here? Let's dive into it."
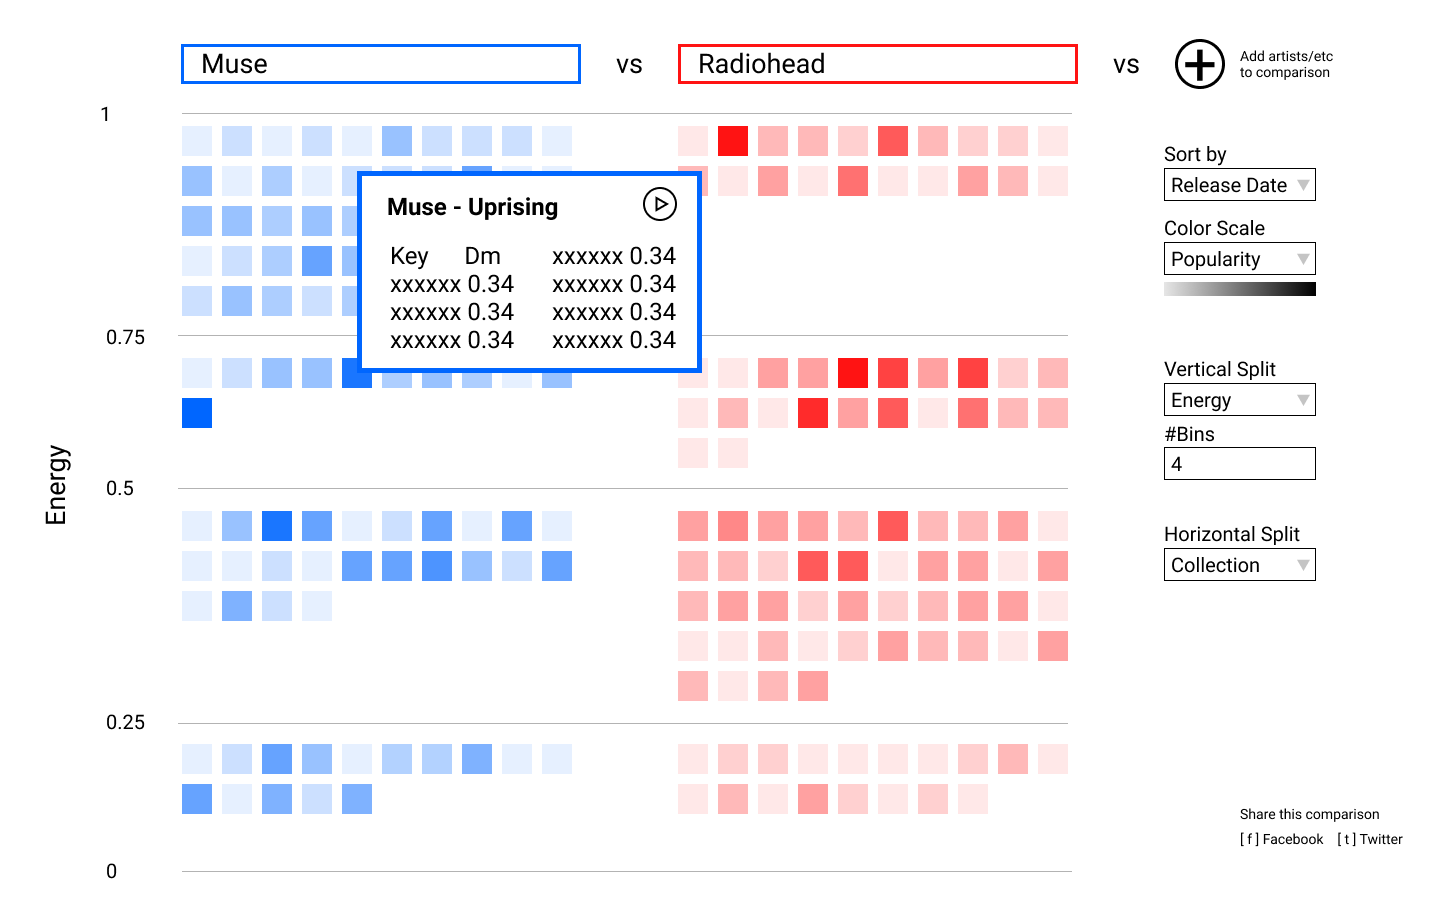
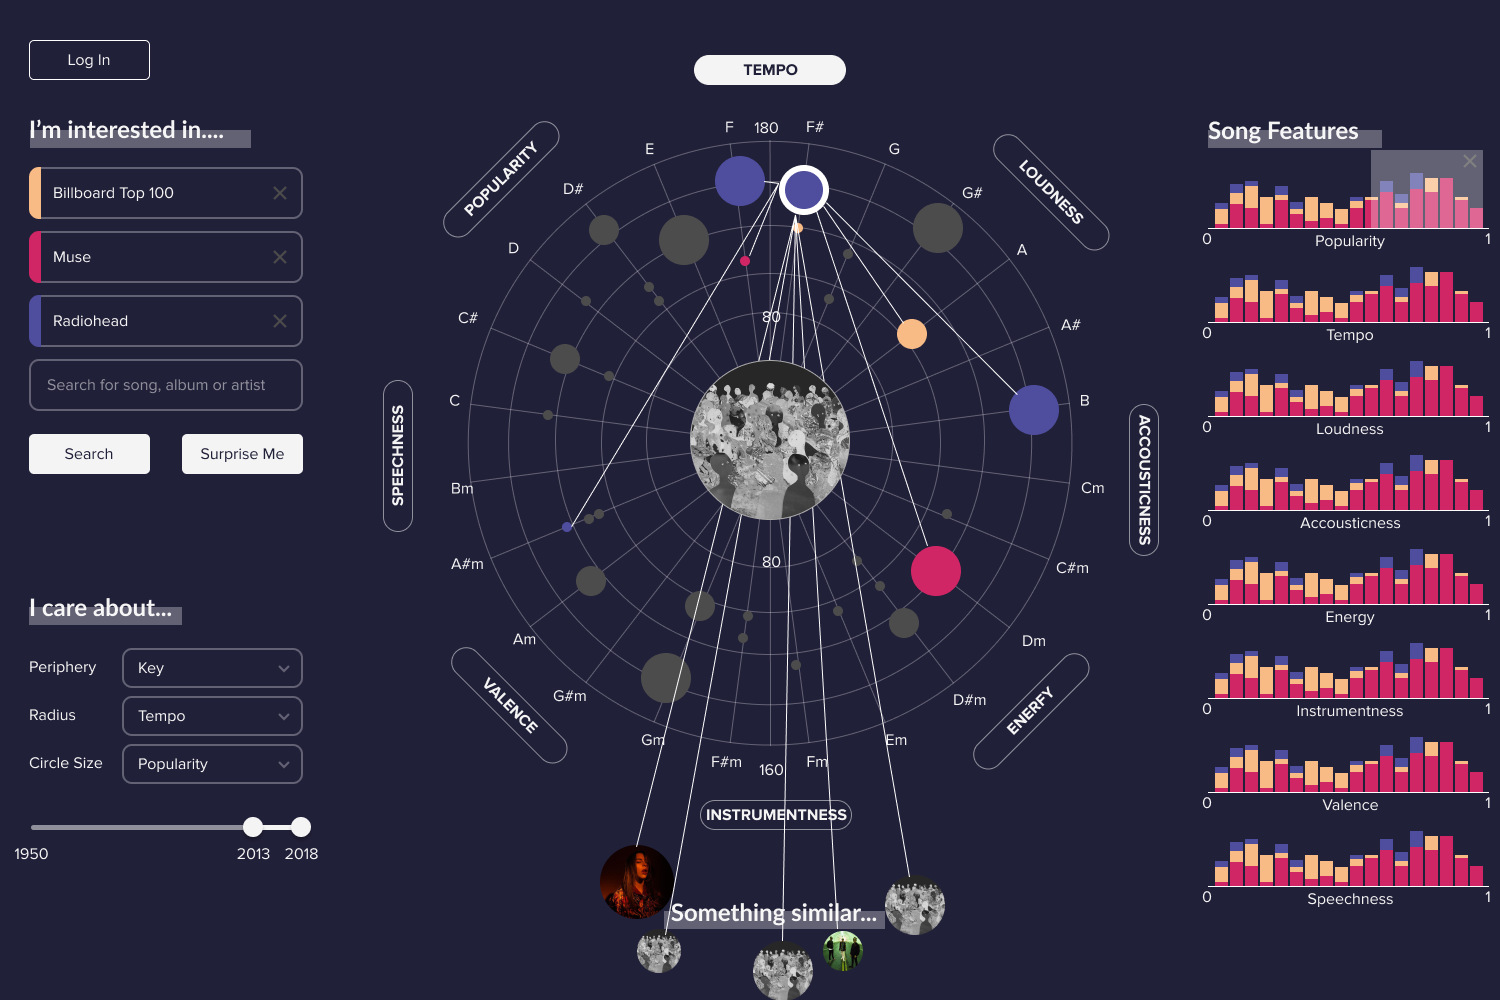
Hovering over a data point plays an audio sample of the song. Vinyl will also suggest songs similar to that song to the users. They can also lock the selection by clicking on the data point.
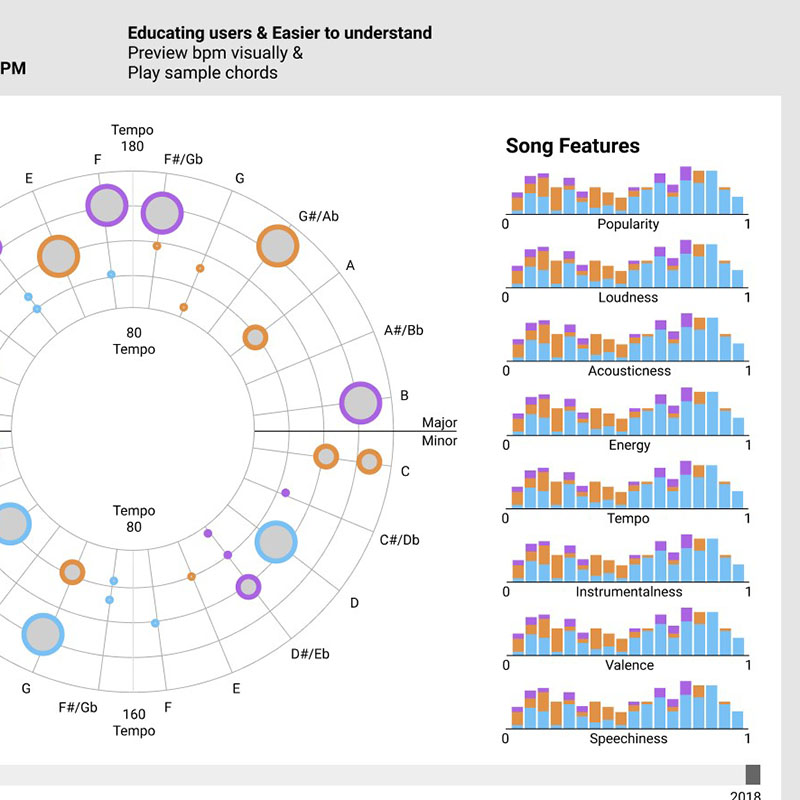
Histograms, on the right, will also be highlighted to show the attribute values of the song.
Explore Different Attributes
"Now let's look at danceability vs popularity... How about tempo?"
Users can select two attributes as the two axes to look for patterns in the data and visualize the artists' musical styles.
Filter Data
"... And where are the songs with high acousticness on this chart?"
To filter the dataset, simply drag the cursor over one of the attribute histograms to filter by the attribute's value. The brush can also be dragged to allow for smooth dynamic query filtering.
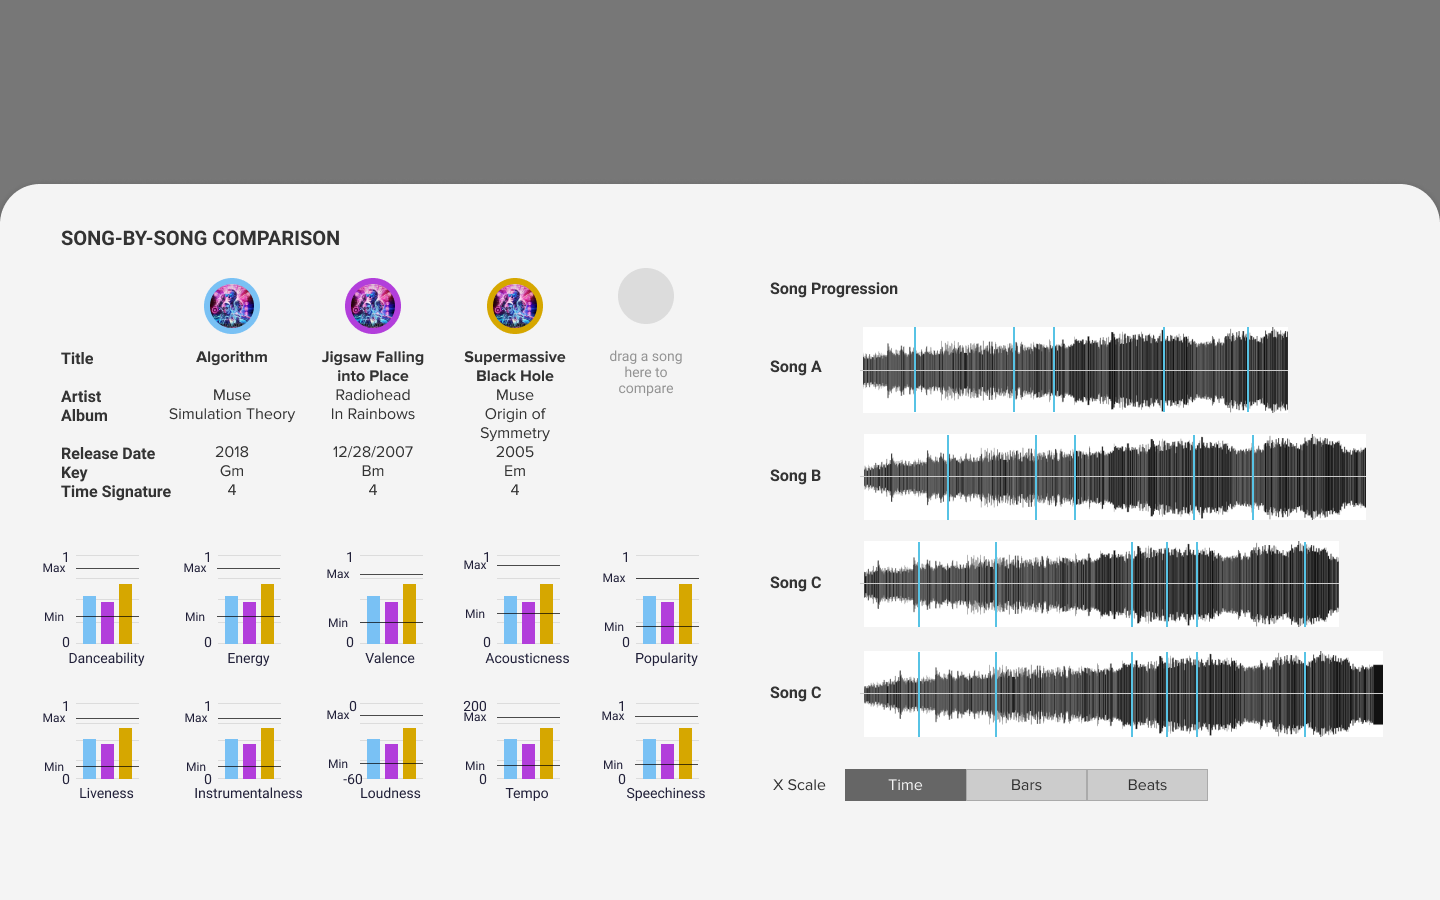
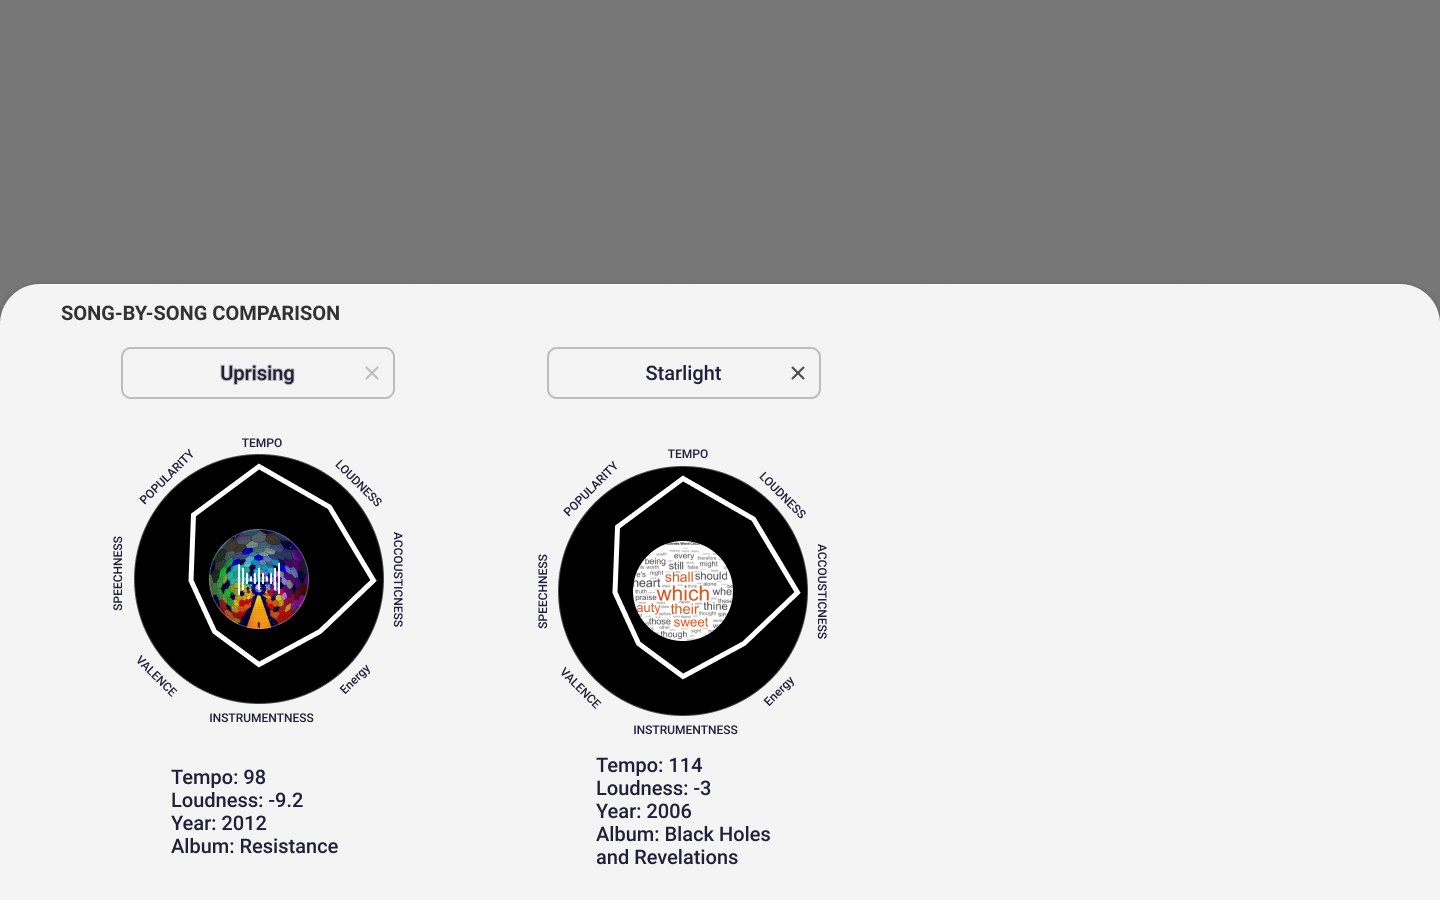
Compare Songs
"There've been debates about these particular two songs. Let's compare them side-by-side."
Users can also drag up to 4 songs to the bottom of the page to compare them side by side through a star plot visualization.
Landing Page & Tutorial
When entering the website, the user will be greeted with a quick onboarding guide for how to read the visualization. Tutorial popups also give them contextual hints to try different features along the way.
"But... Where do I start? How do I read this? "
Cluster by Similarity
People who are unfamiliar with the different attributes might feel overwhelmed by them. "Just Cluster by Similarity" helps make it easier for novice users to get an overview of the dataset without needing much musical expertise. The feature is implemented using the Principal Component Analysis (PCA) technique.
"Well, I don't know which attributes are important. Can you just give me an overview map?"

Find a Song
Once an artist is loaded, there will be many songs plotted on the chart. Users can easily find the song they are interested in by typing its name in the search box.
"I've added Lil Nas X here. Where's 'Old Town Road' on this chart?"
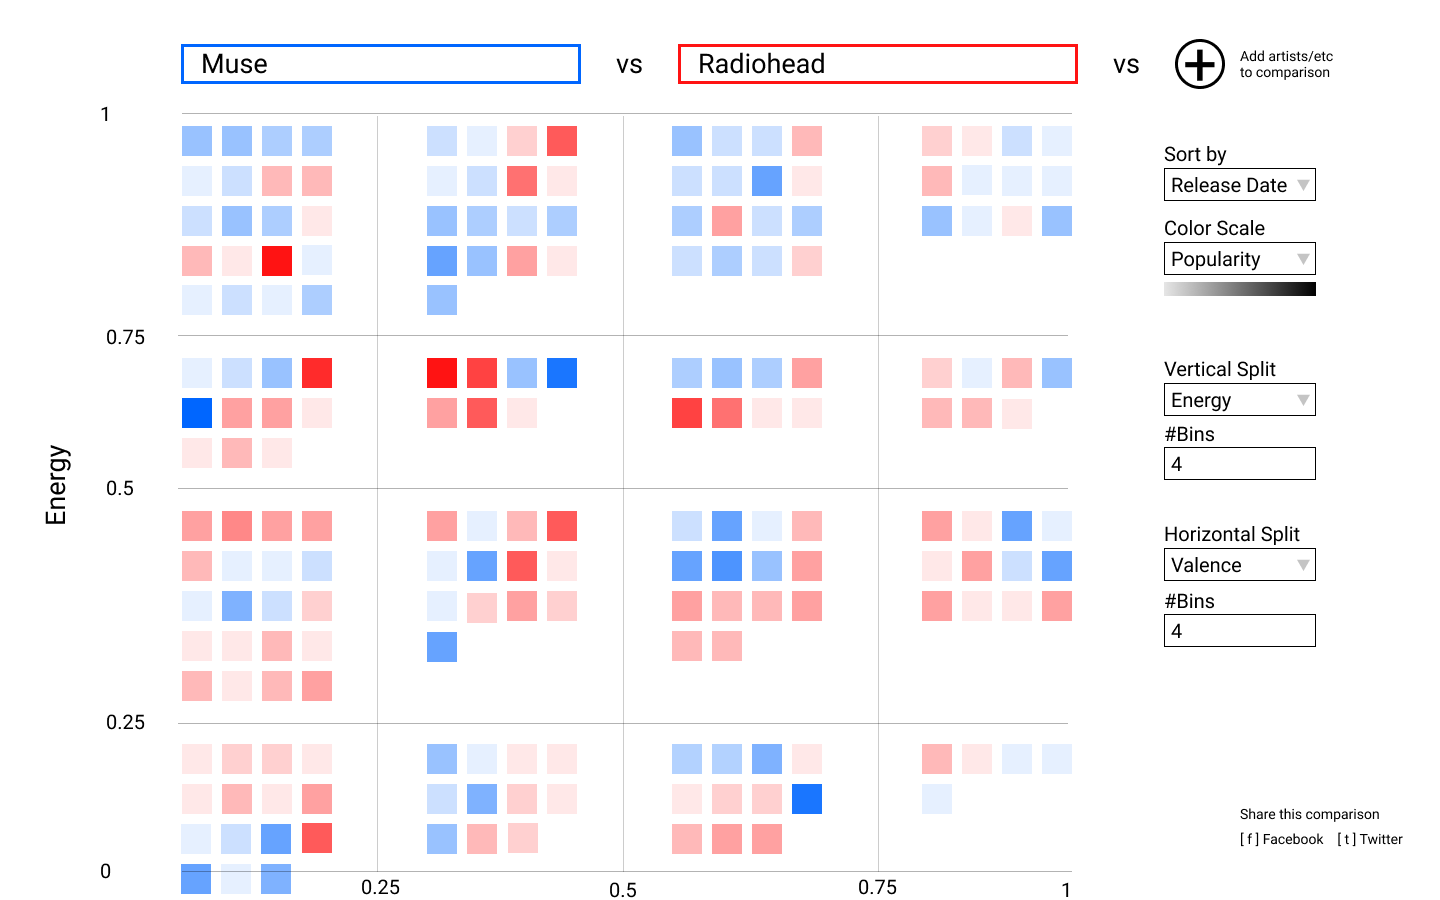
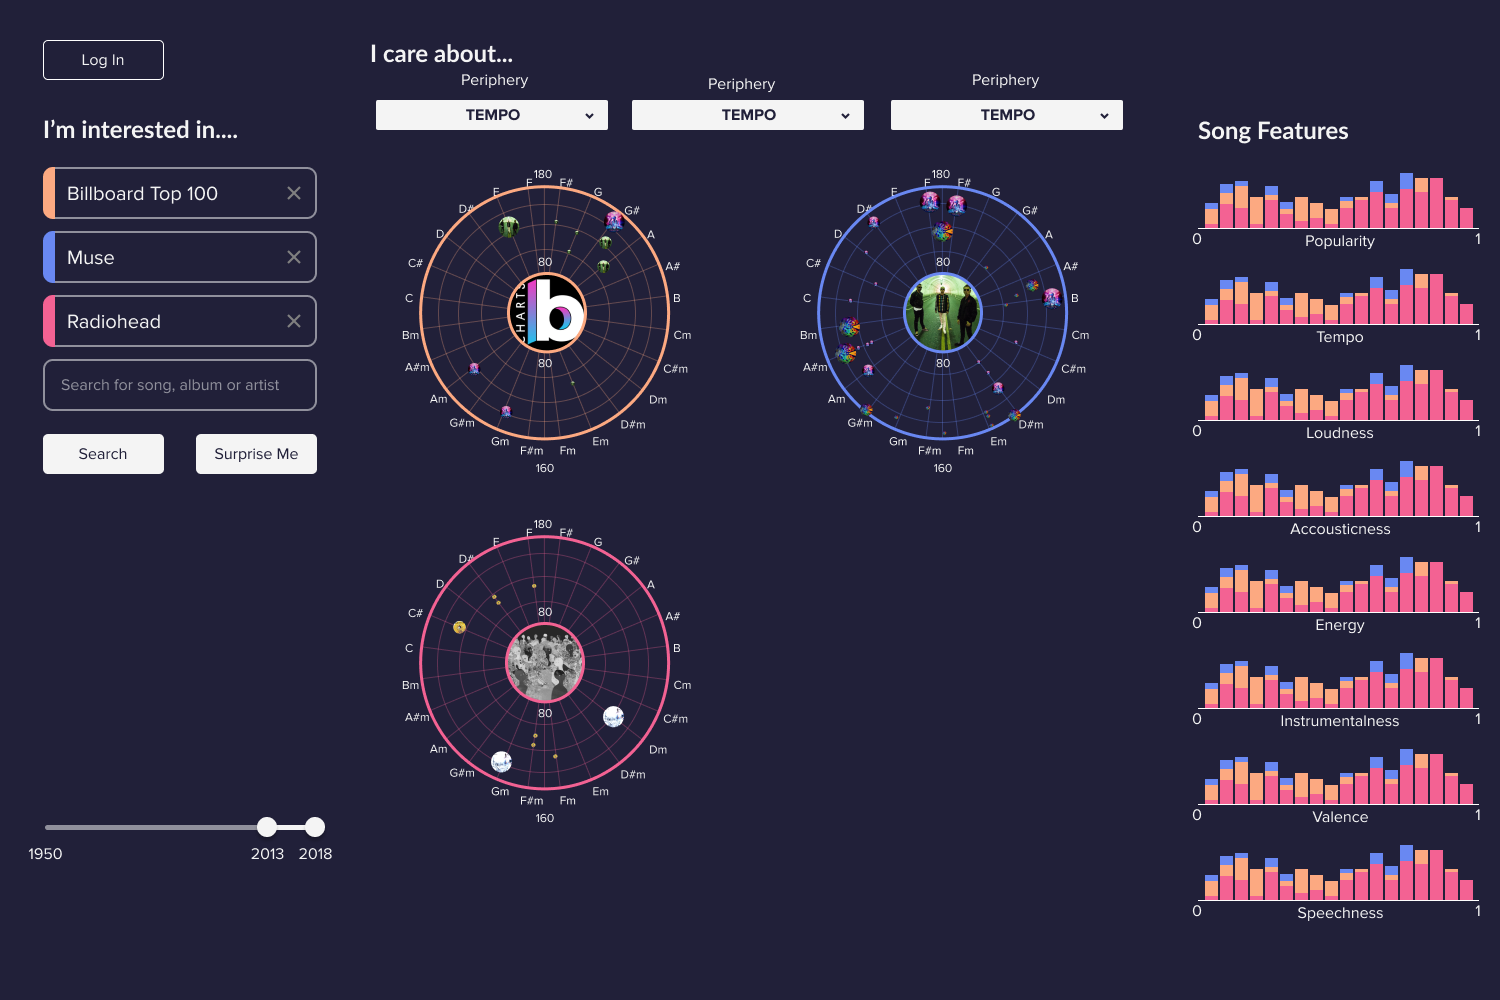
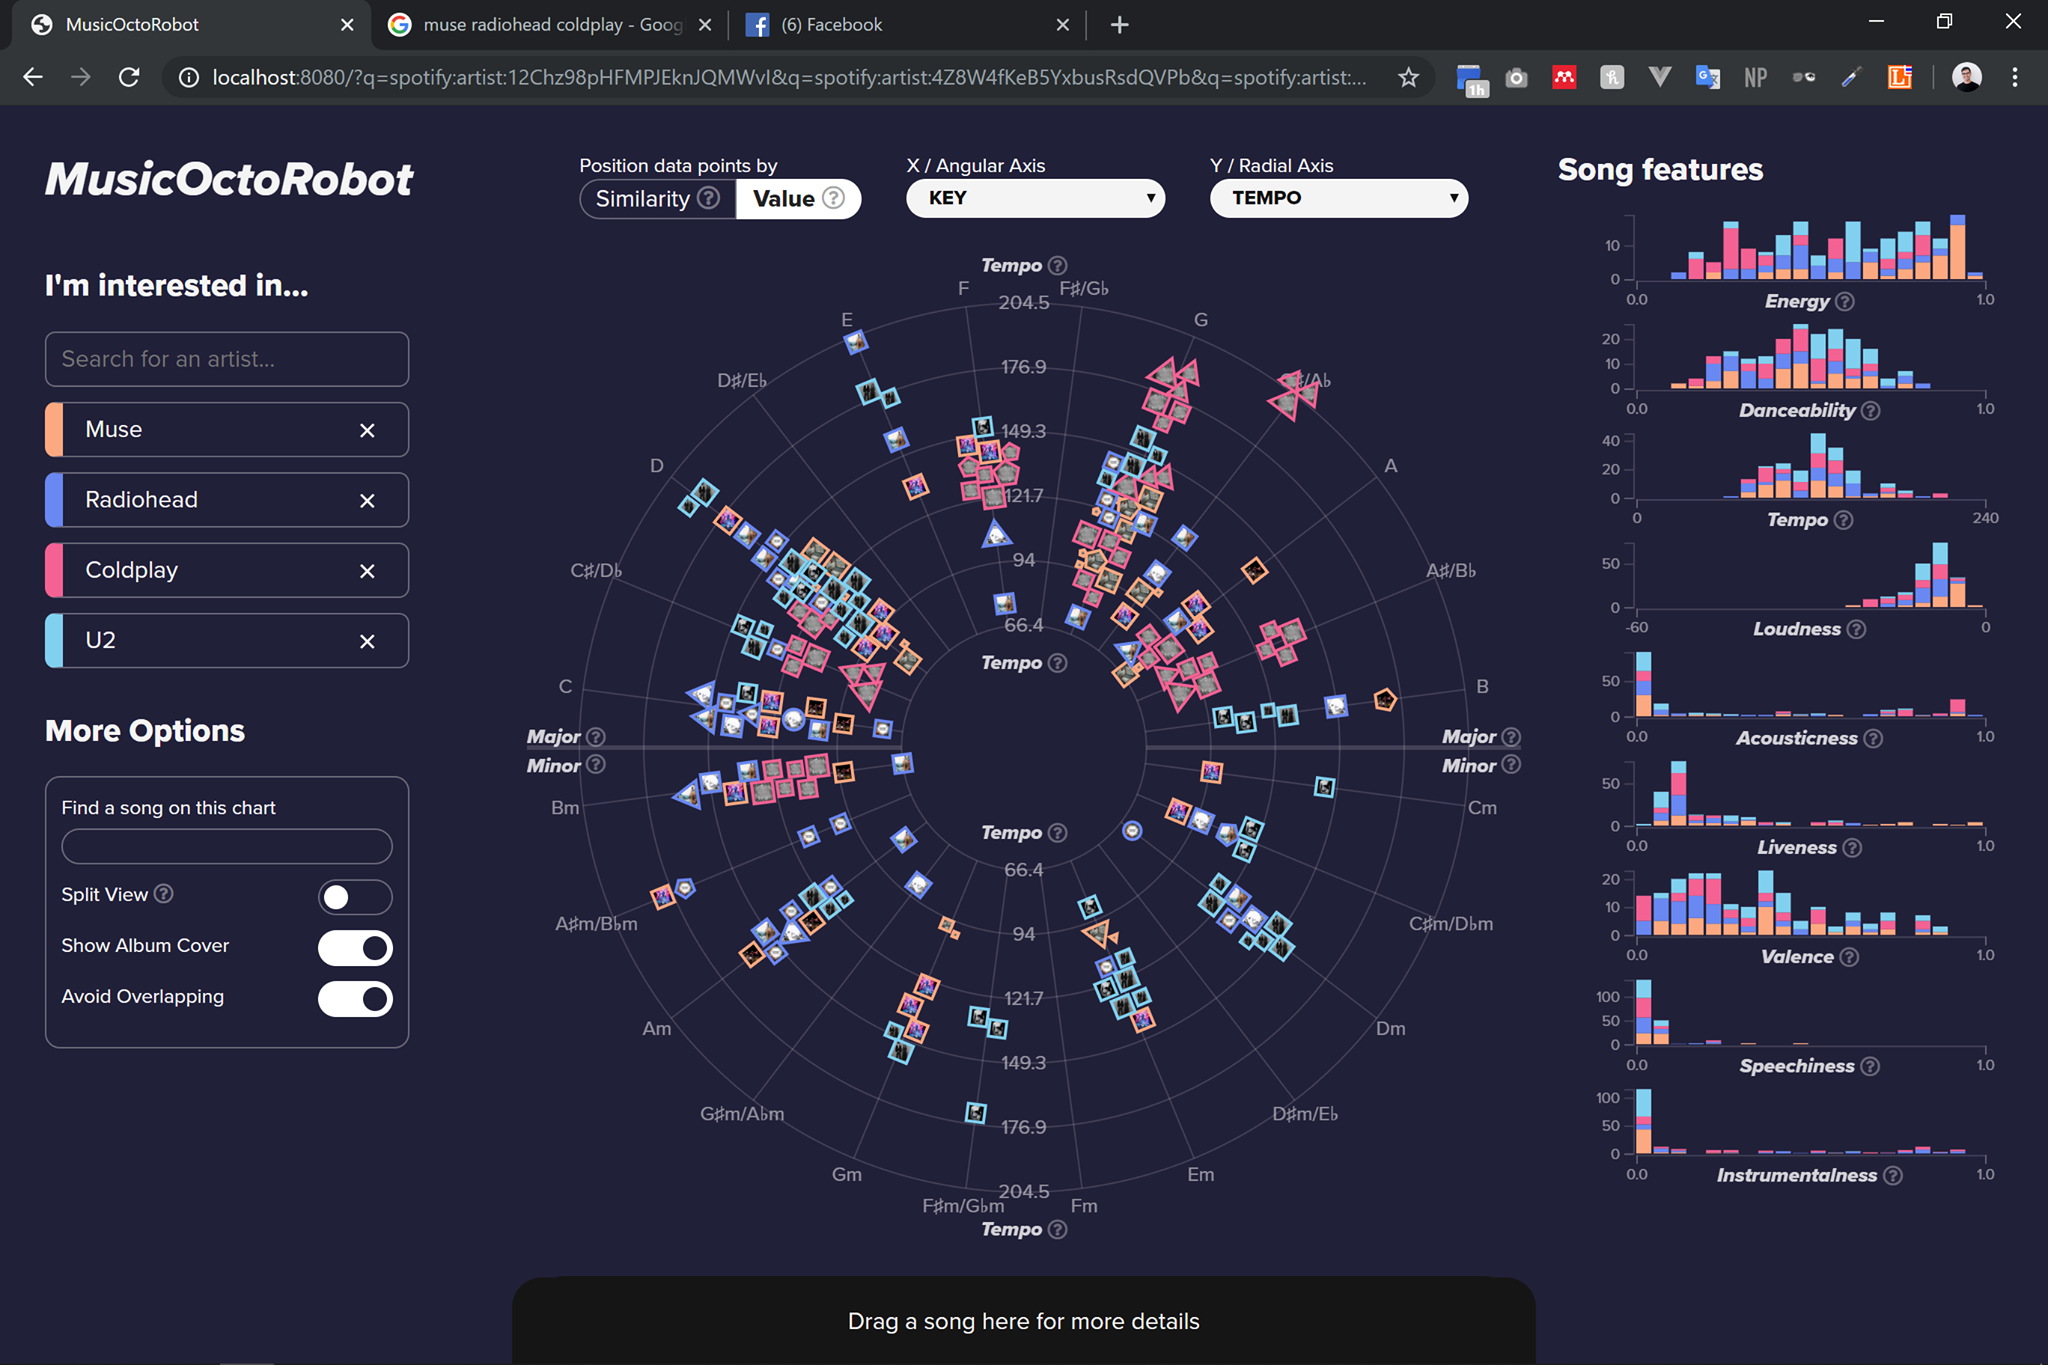
Split View & Other Settings
Split view, Show Album Art, and Avoid Overlapping toggles help users deal with cluttered chart views. Users can simply toggle these options to find the view that is best suited to their data analysis task.
"The view is getting cluttered. Let's plot them separately. Album artwork is also in the way. Let's turn it off."
Design Details
Spinning Data Points
When hovered, data points will spin in sync with the audio preview, giving feedback to the user.
Reference Lines
Reference lines are shown to make it easier to reference the axes values to the data point.
Tooltips
Short tooltips help explain music terminology to users who are not familiar with them in simple terms.
Shareable URL
Users can copy the URL of the page and share the current comparison with their friends.
Process Overview
How did we get here?
1. Research
- Analysis of User Tasks
- Understanding the Dataset
- Competitive Analysis
2. 1st Design Iteration
- Design Brainstorming
- Sketching
- Low-fidelity Wireframing
- Expert Feedback
3. 2nd Design Iteration
- Mid-Fidelity Wireframing
- Prototype Development
- Expert Feedback
4. Testing & Final Tweaks
- Visual Design
- Informal Usability Testing
- Final Design Tweaks
Research
User Groups & Tasks
We identified our target user group as music lovers who have their own favorite artists and are eager to learn more about them. In this group, the level of music theory knowledge varies widely.

Casual Listeners
- Usually have favorite genres
- Know mostly about pop or famous artists
- Little to no music theory knowledge
Example Queries
- "What are some rough descriptions and groupings of [artist]'s musical styles?"
- "What is [artist]'s most popular song?"
Music Fans
- Have niche interests in specific genres
- Basic to little music theory knowledge
- Know a lot about specific artists
Example Queries
- "How does [artist A] compare to the controversially "similar" [artist B]?"
- "How did [artist]'s style change over time?"

Music Experts
- Listen to a wide range of genres
- Have niche interests in specific artists/genres
- Profound music theory knowledge, like to analyze music
Example Queries
- "What key does [artist]'s write their songs in, and does this suggest a specific songwriting style?"
- "How did [artist]'s style change over time? What influenced those changes?"
Understanding the Dataset
Before designing the visualization, we first needed to understand what is available in the dataset. The dataset we were using in this project was Spotify Web API's track info and audio features data.
Track Info
Includes basic metadata about the song such as name, artists, album, release date, popularity index, as well as album artwork and 30-second preview URLs. More Info
Audio Features
Includes the song's musical attributes such as key and tempo, as well as other non-standard measures such as "danceability", "energy", and "valence". These values are computed by Spotify's audio analysis algorithms. More Info
Examples of available attributes in the dataset
| Attribute | Data Type | Description |
|---|---|---|
| Track Info Attributes | ||
| Name | String | Name of the track |
| Artists | Array of "Artist" object | List of artists who are involved in this song |
| Preview URL | URL String | Link to the song's 30 seconds preview audio file |
| Popularity | Float (0~100) | Popularity index of the song at the moment |
| Audio Features Attributes | ||
| Key & Mode | Pair of integers (0~11, 0~1) | The key that the song is in. The numbers can be mapped to musical keys, e.g., C major, F# minor, etc. |
| Tempo | Float (≥ 0) | The pace of the song, measured in beats per minute (BPM). |
| Loudness | Float (≤ 0) | Average amplitude of the song's sound wave, measured in decibels (dB). |
| Valence | Float (0~1) | Musical positiveness of the song. The closer to 1, the more "happy" the song sounds and vice versa |
Competitive Analysis
We looked at other existing music information visualization tools (especially those powered by Spotify API) to learn what has been done and what opportunities we could design for.
We found that existing tools are mostly genre-focused or artist discovery-focused. There are no exploratory tools that allow users to compare and analyze artists freely by their song attributes, posing an opportunity for us to create a tool in this space.
These are examples of what we found:
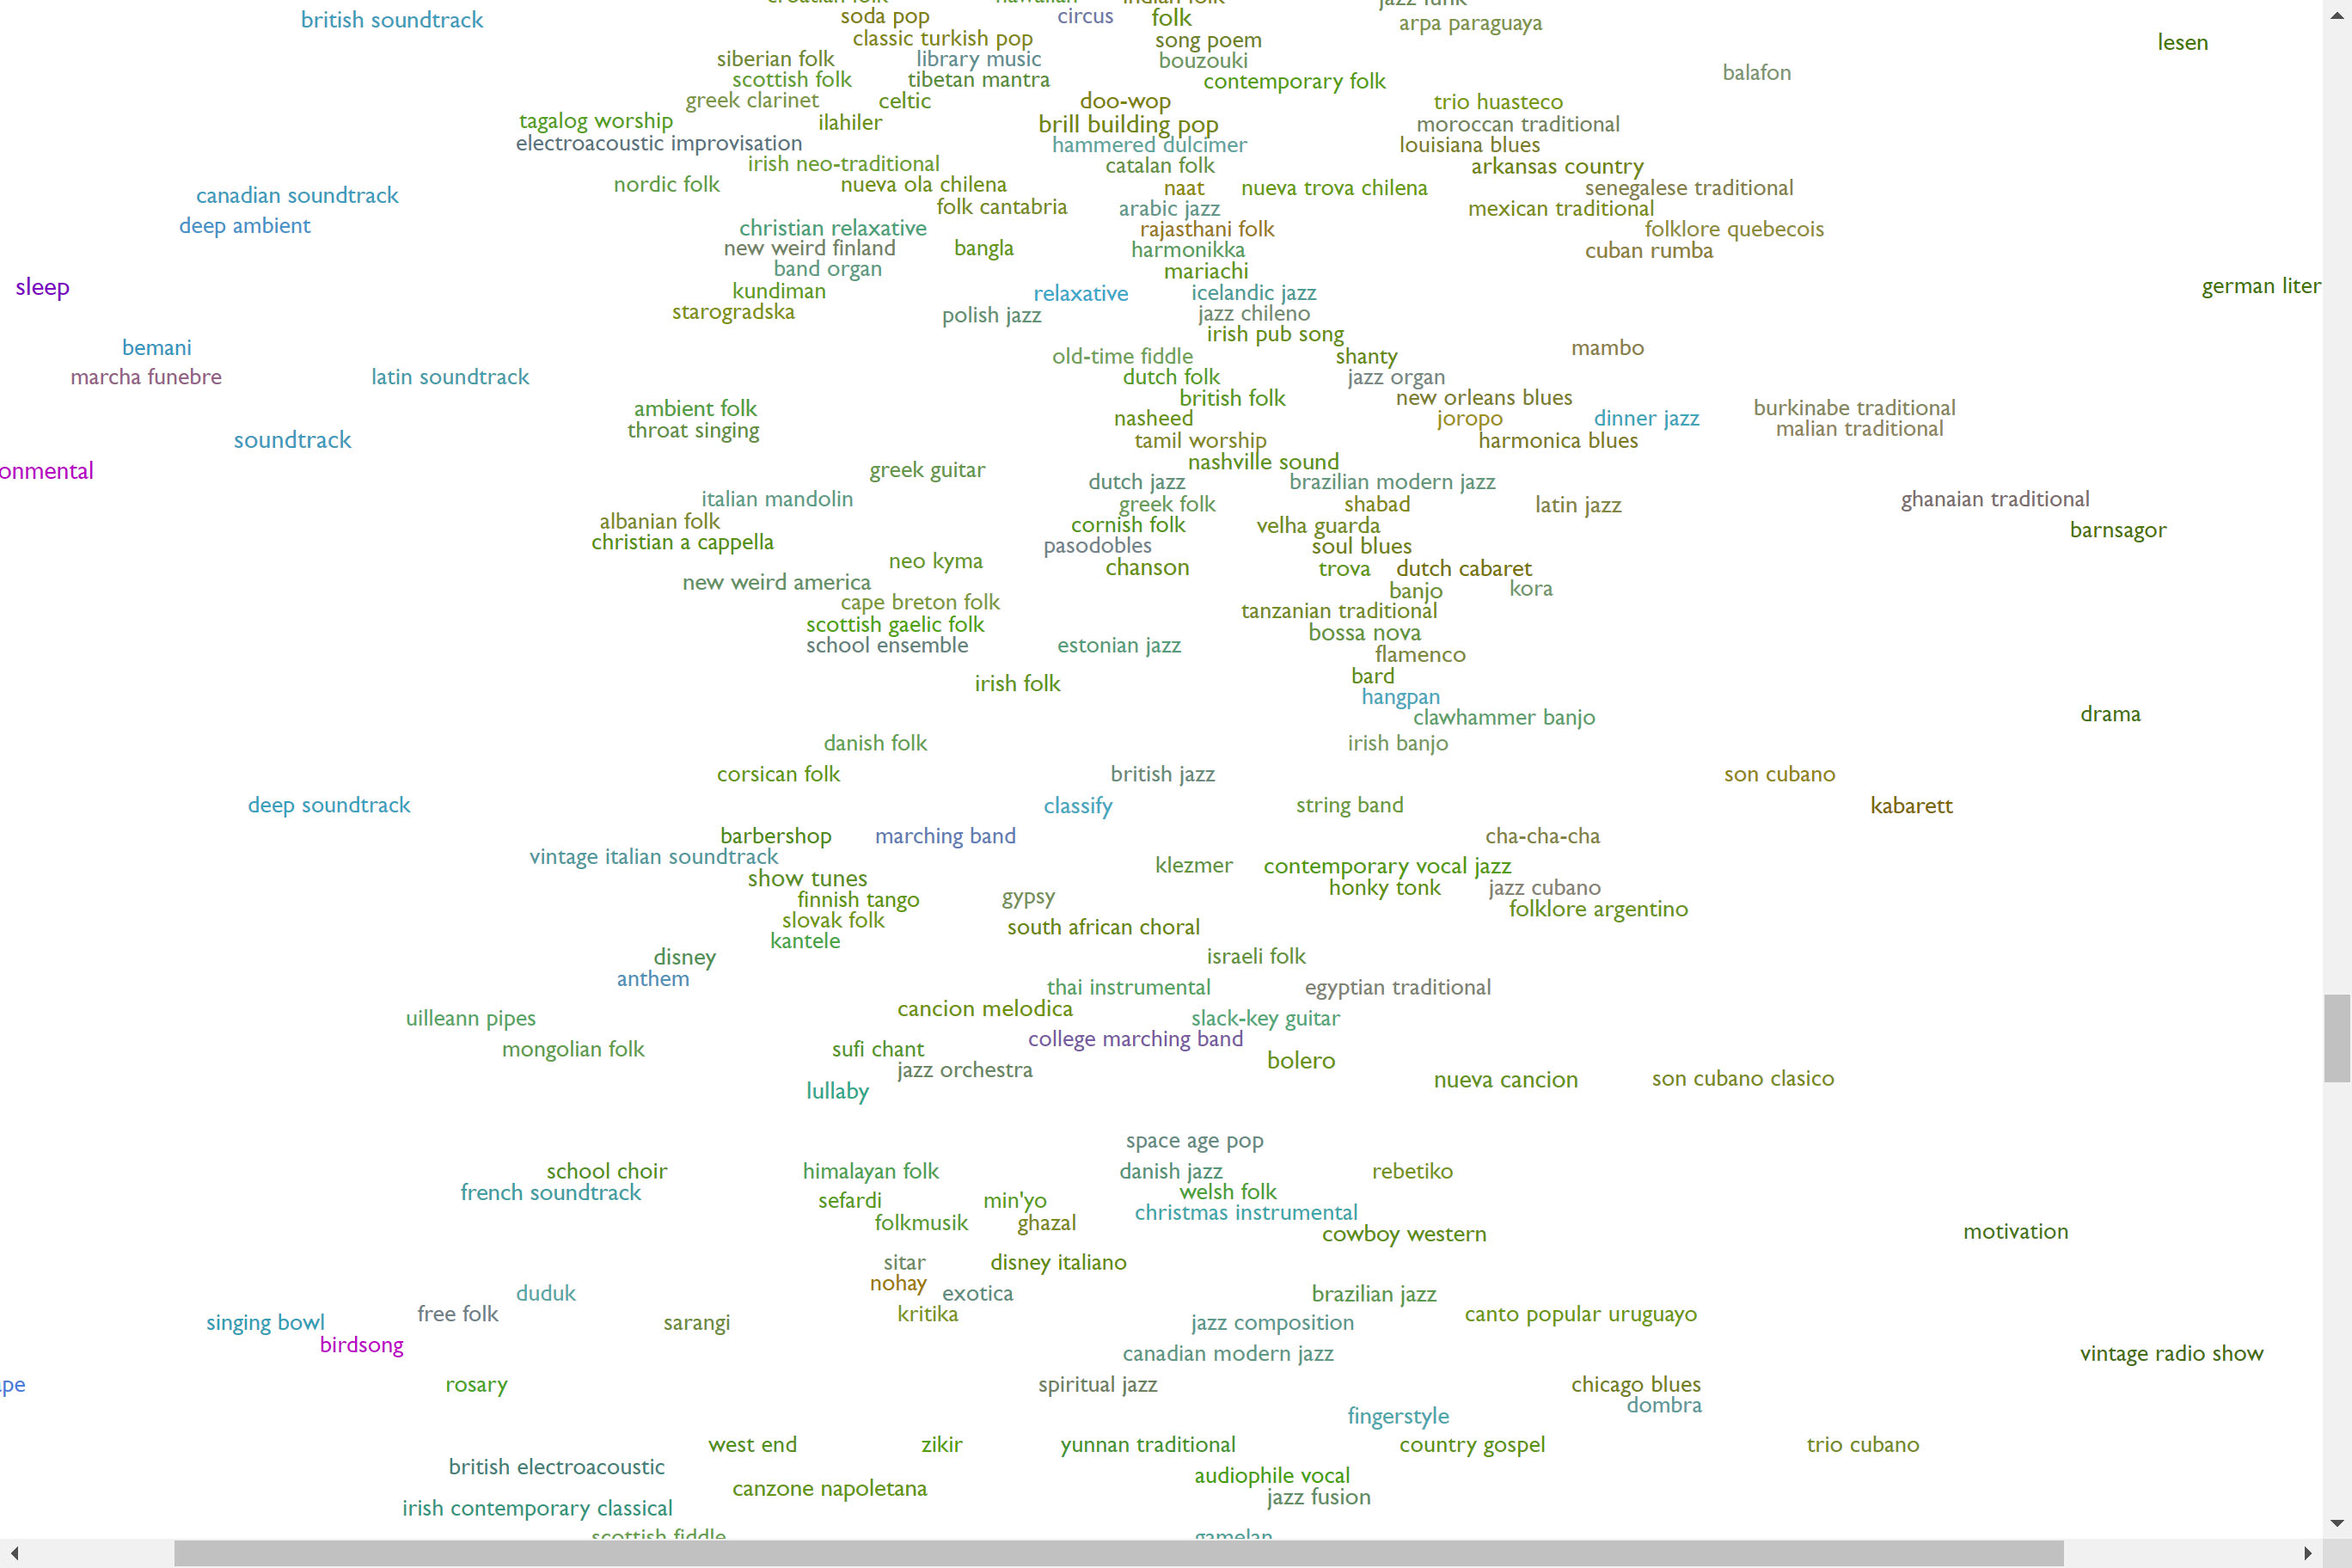
Every Noise at Once
A text scatterplot-based map of thousands of genres and sub-genres. Users can click on the genre name to listen to a sample song in that genre.
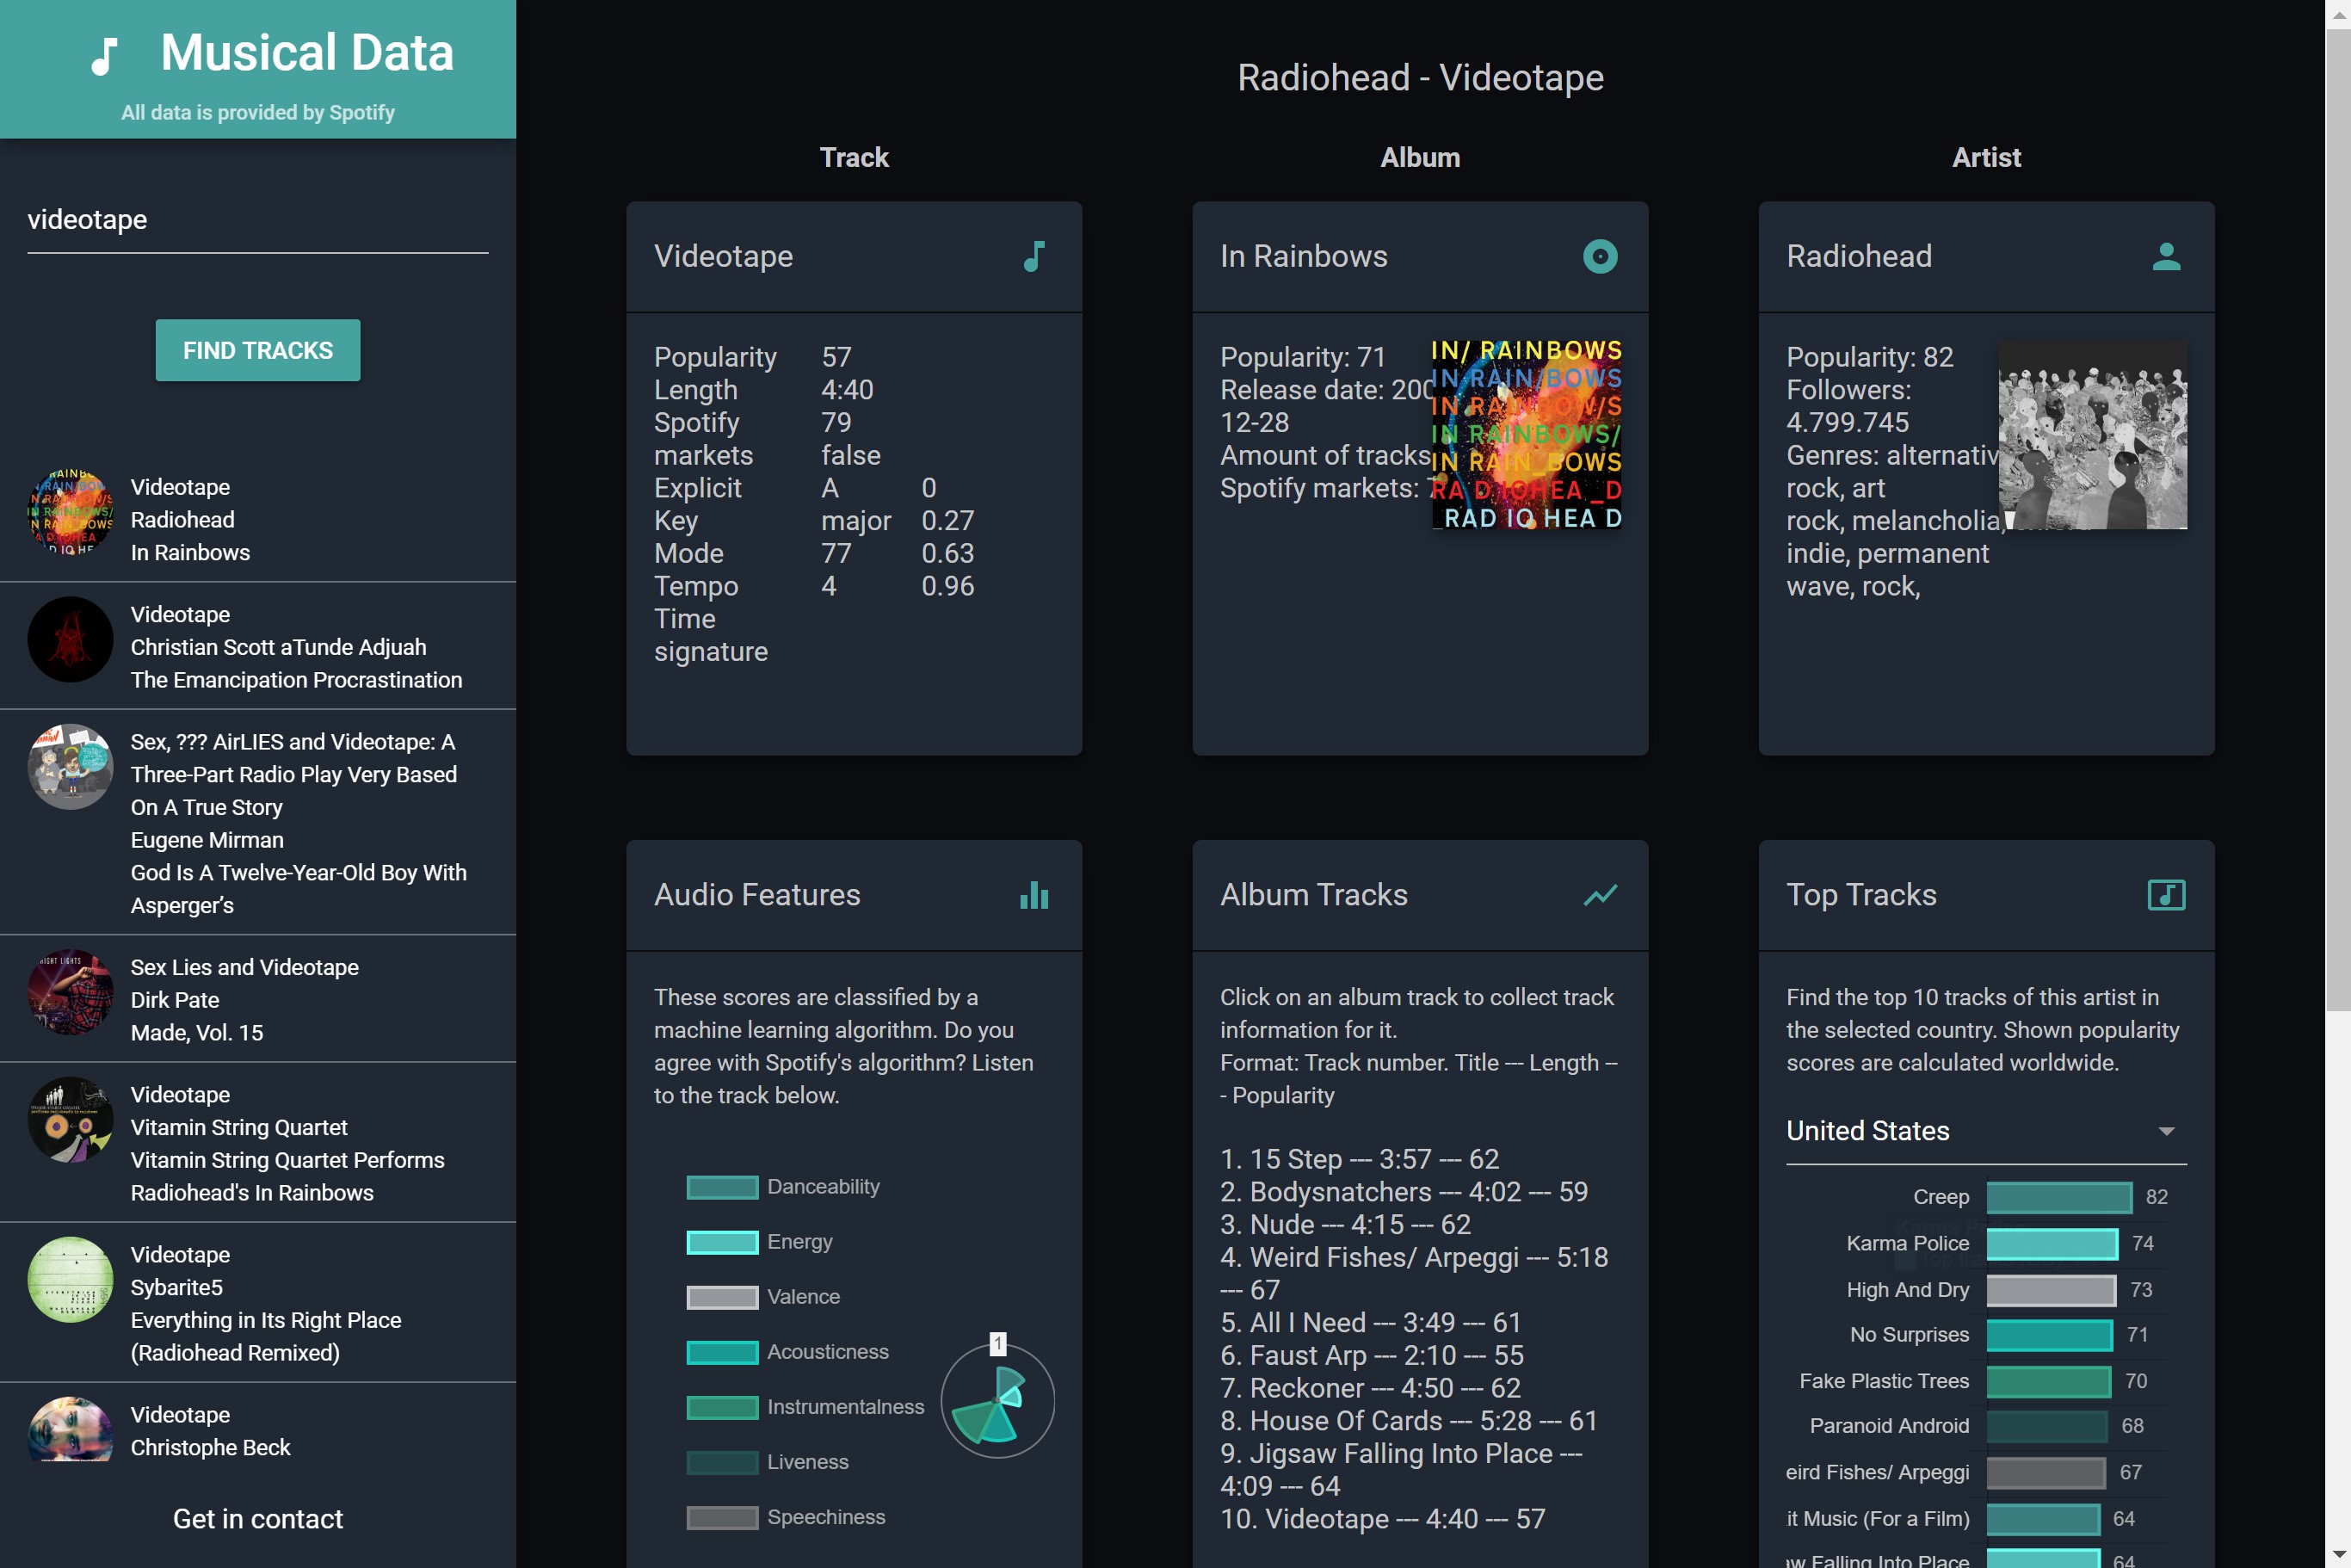
Musical Data
A Spotify API-powered tool that allows users to view track info and audio feature data of a selected song.
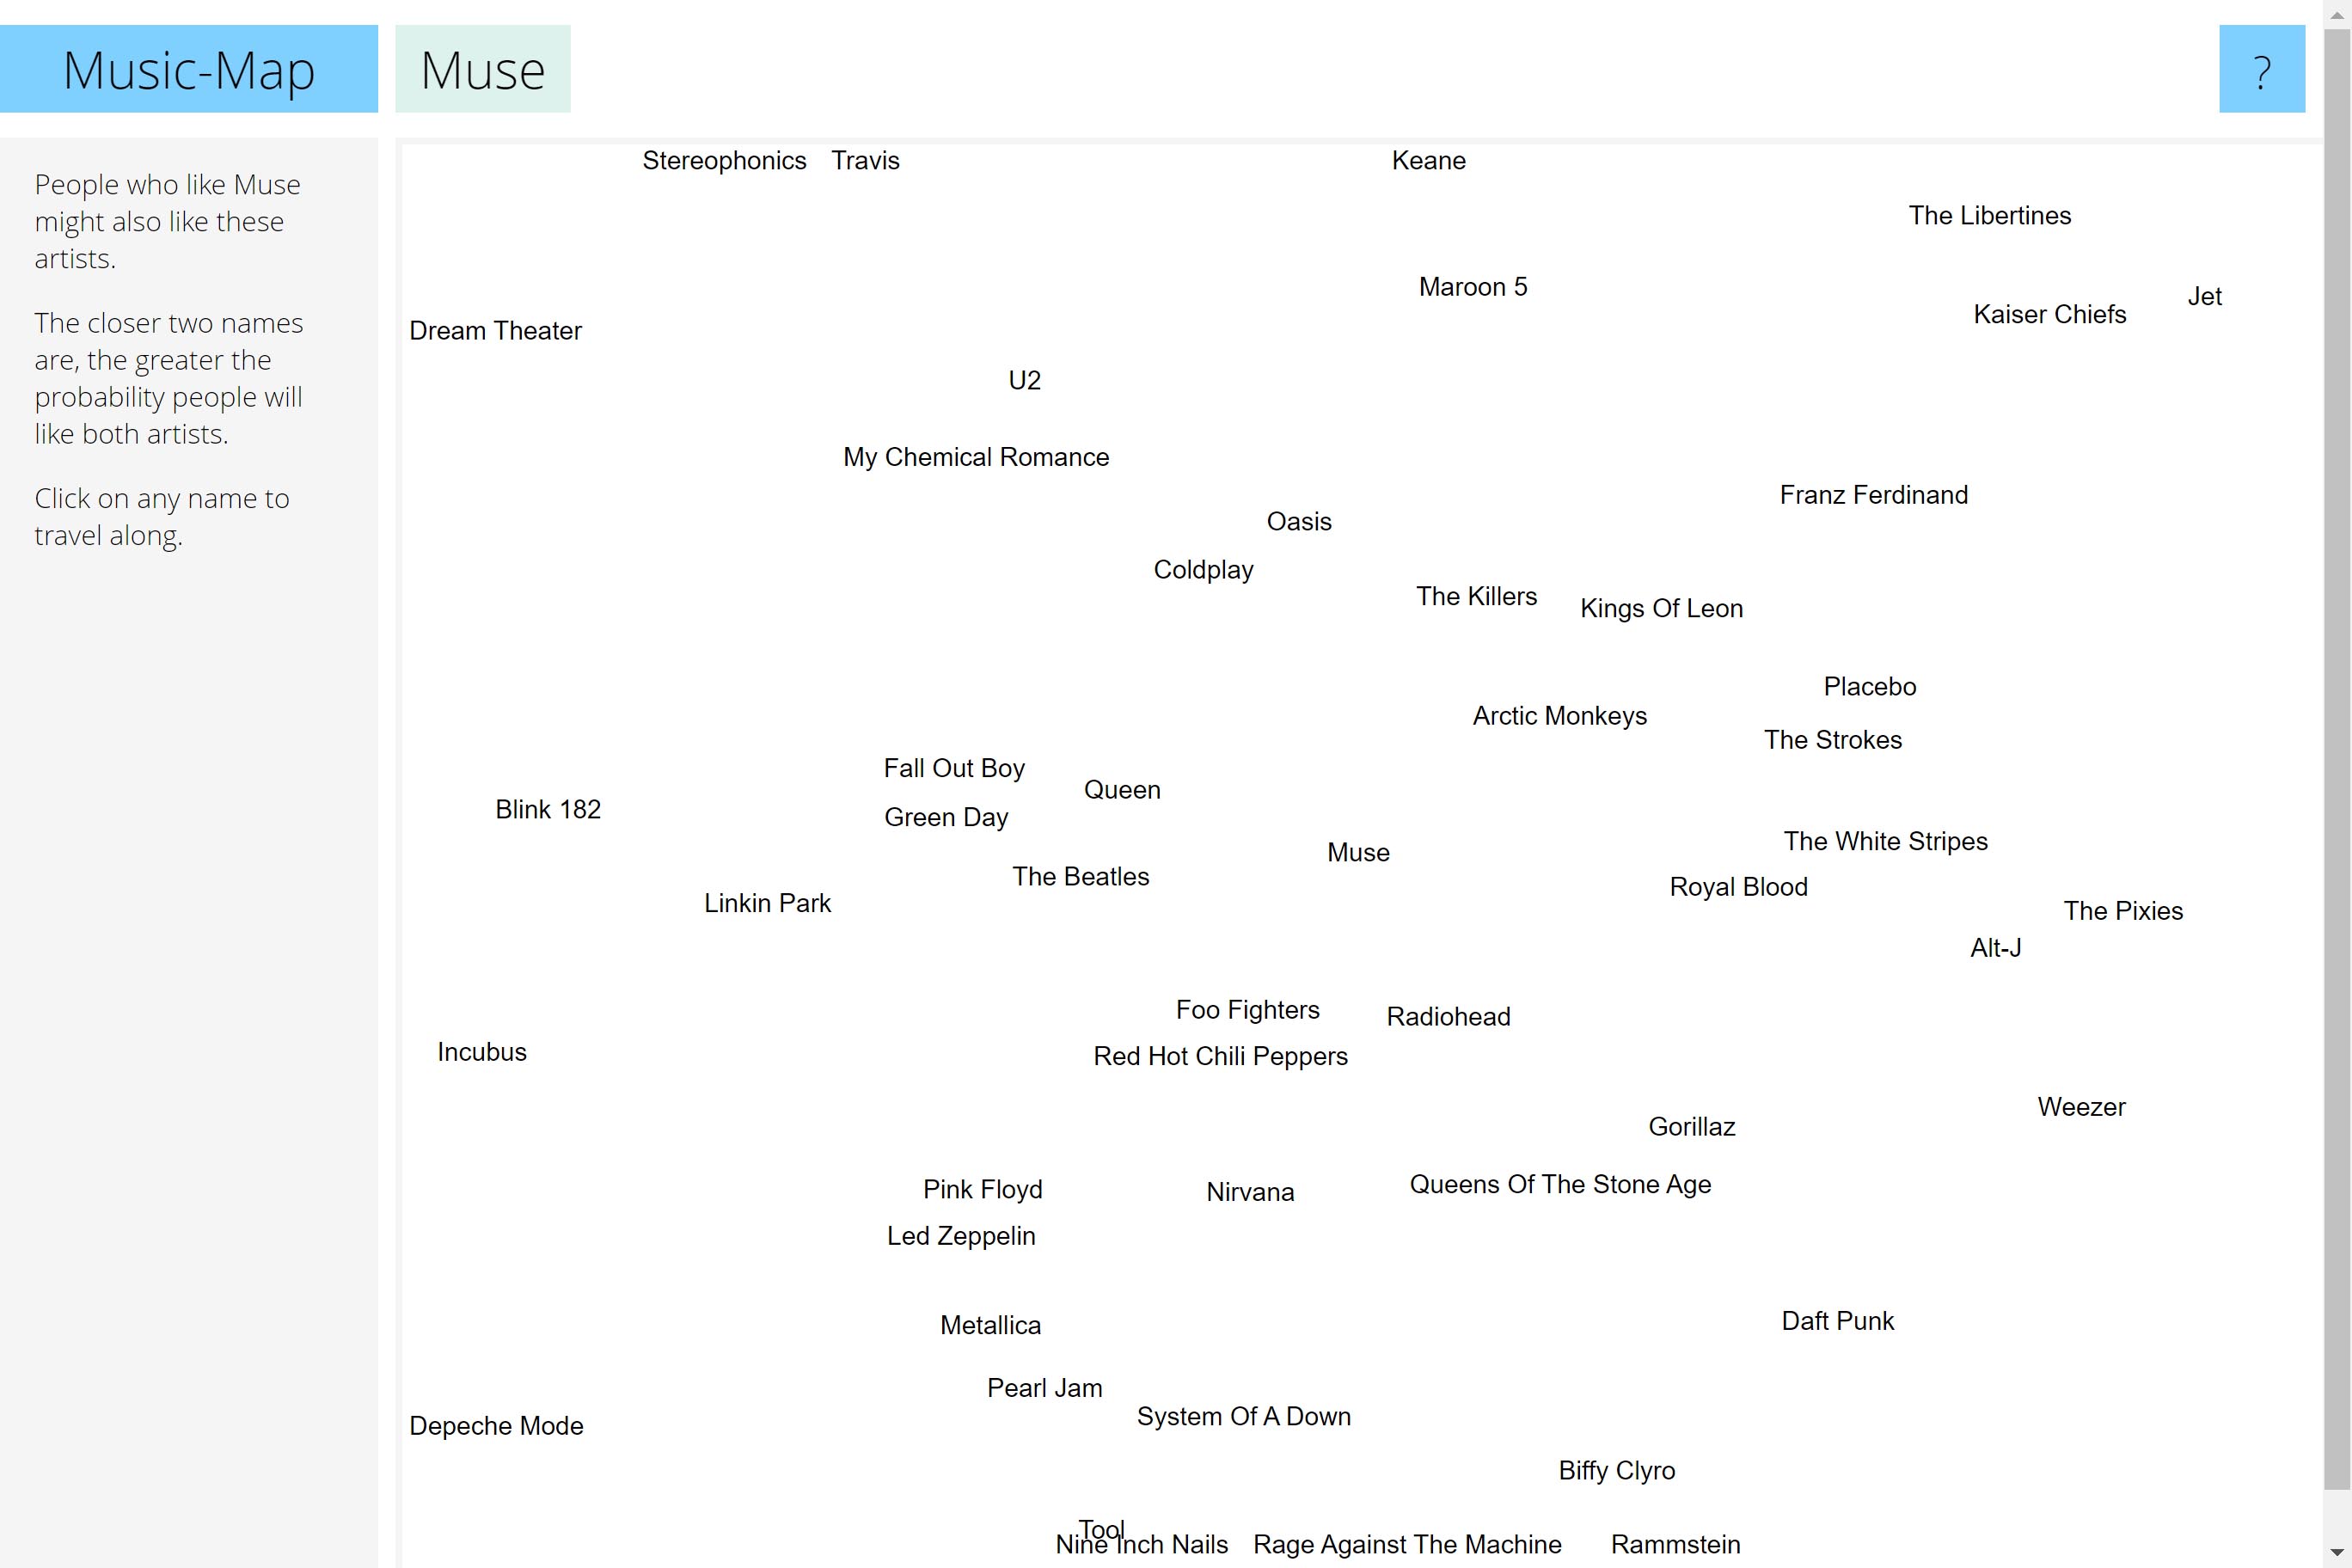
Music Map
A network/cluster visualization showing artists similar to a selected artist, helping users discover new artists based on their taste.
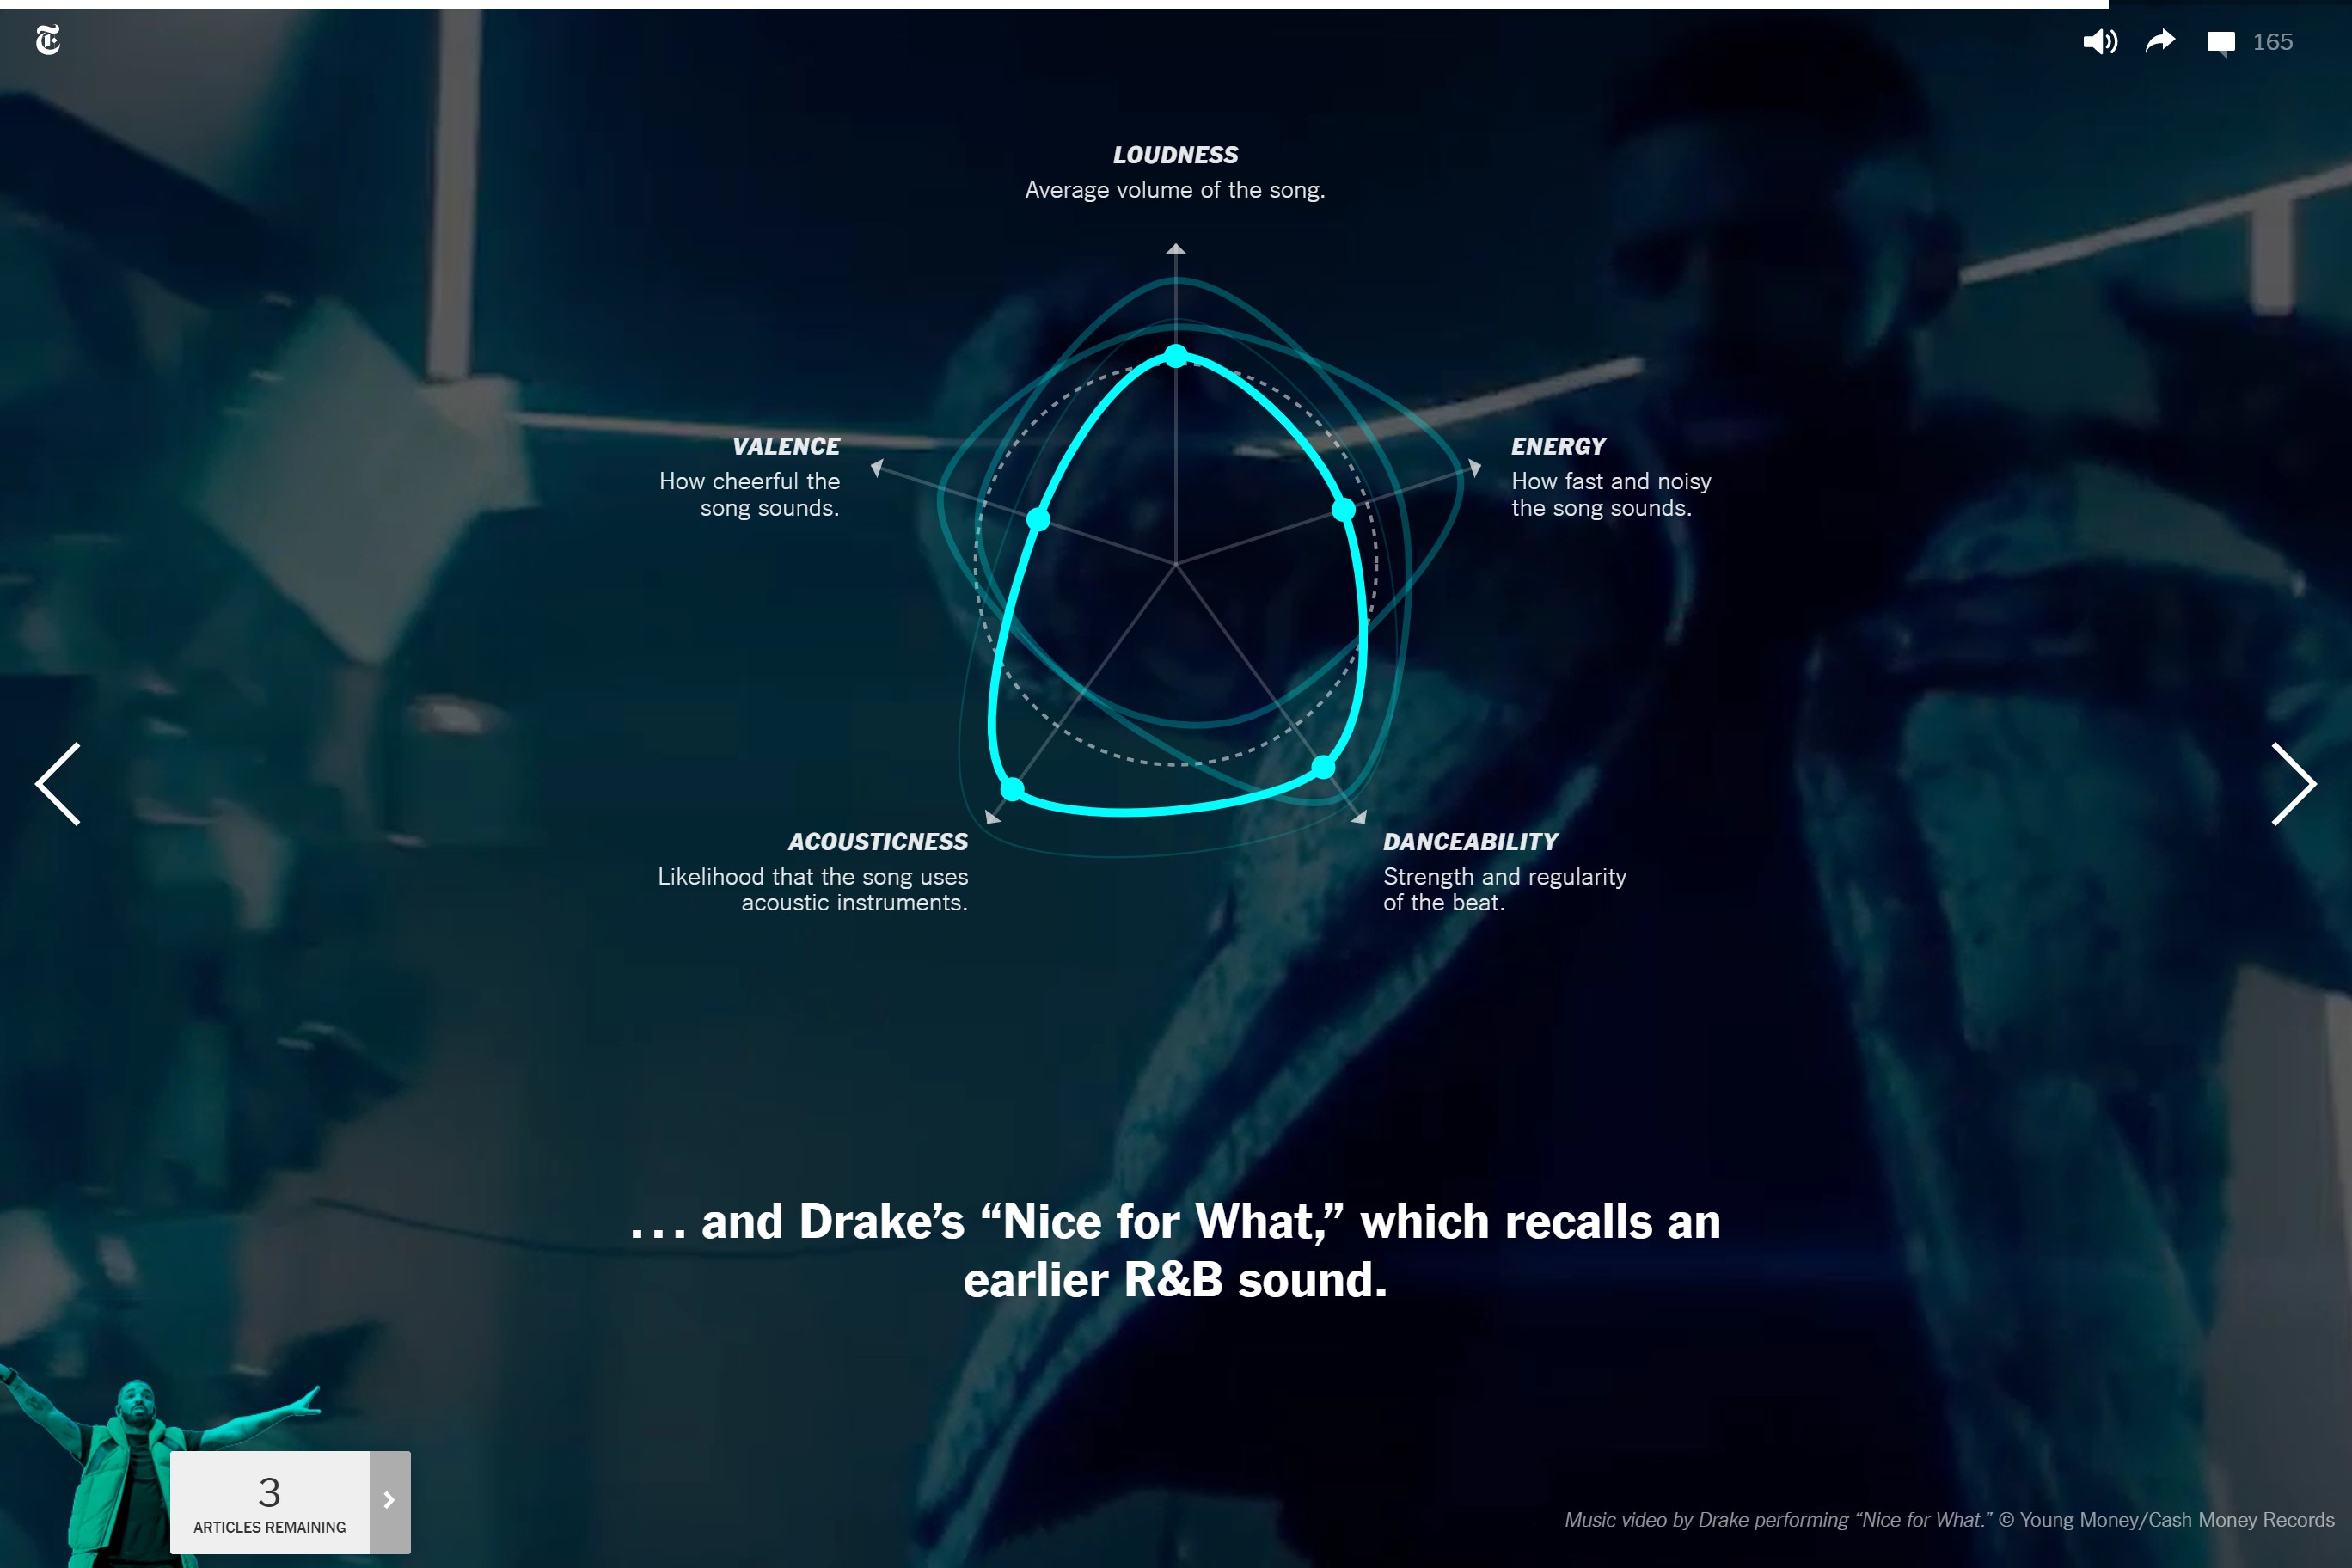
Why do Songs of the Summer Sound the Same?
A storytelling visualization that shows how hit songs are similar or different using attributes that are available on Spotify API.
1st Design Iteration
Defining the Core Feature & Design Goals
Having analyzed user tasks and available data in the previous phase, we defined our core features and design goals as follows:
This first goal was the biggest challenge for the project. Since the dataset contained mostly "technical" attributes, we had to make sure it's interesting and easy to understand for people with varied musical knowledge.
Core Feature
Music Comparison
Allow users to compare and visualize "collections" of music against each other.
We defined a "collection" as any group of songs grouped by any criteria, e.g., by artists, albums, playlists, genre, etc.
Design Goals
1. Appeal to Broad Audience
We want the visualization to be enjoyed by people with a wide range of musical backgrounds.
2. Socialable
Make it easy for users to share the comparisons with other people. Sparking discussions among music fans.
3. Informative
Provide both high- and low-level information for users to explore as well as to help users learn more about music.
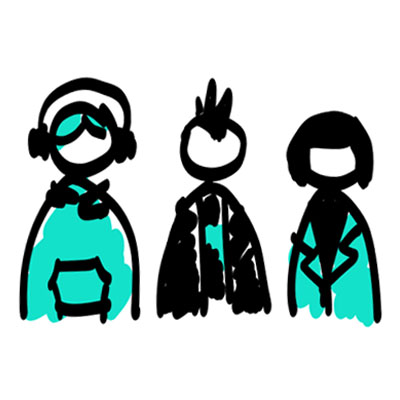
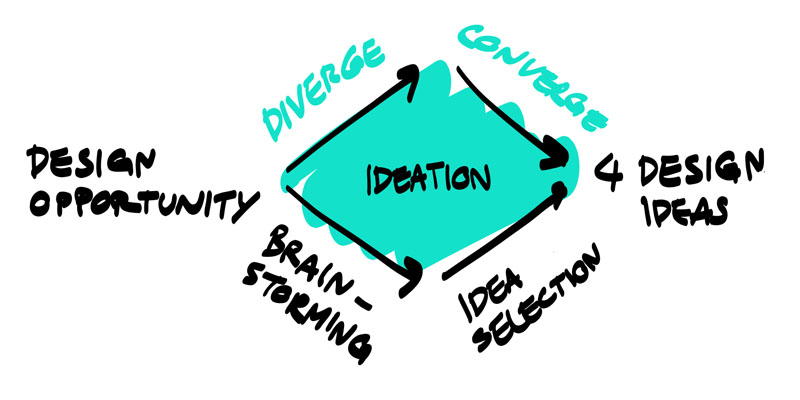
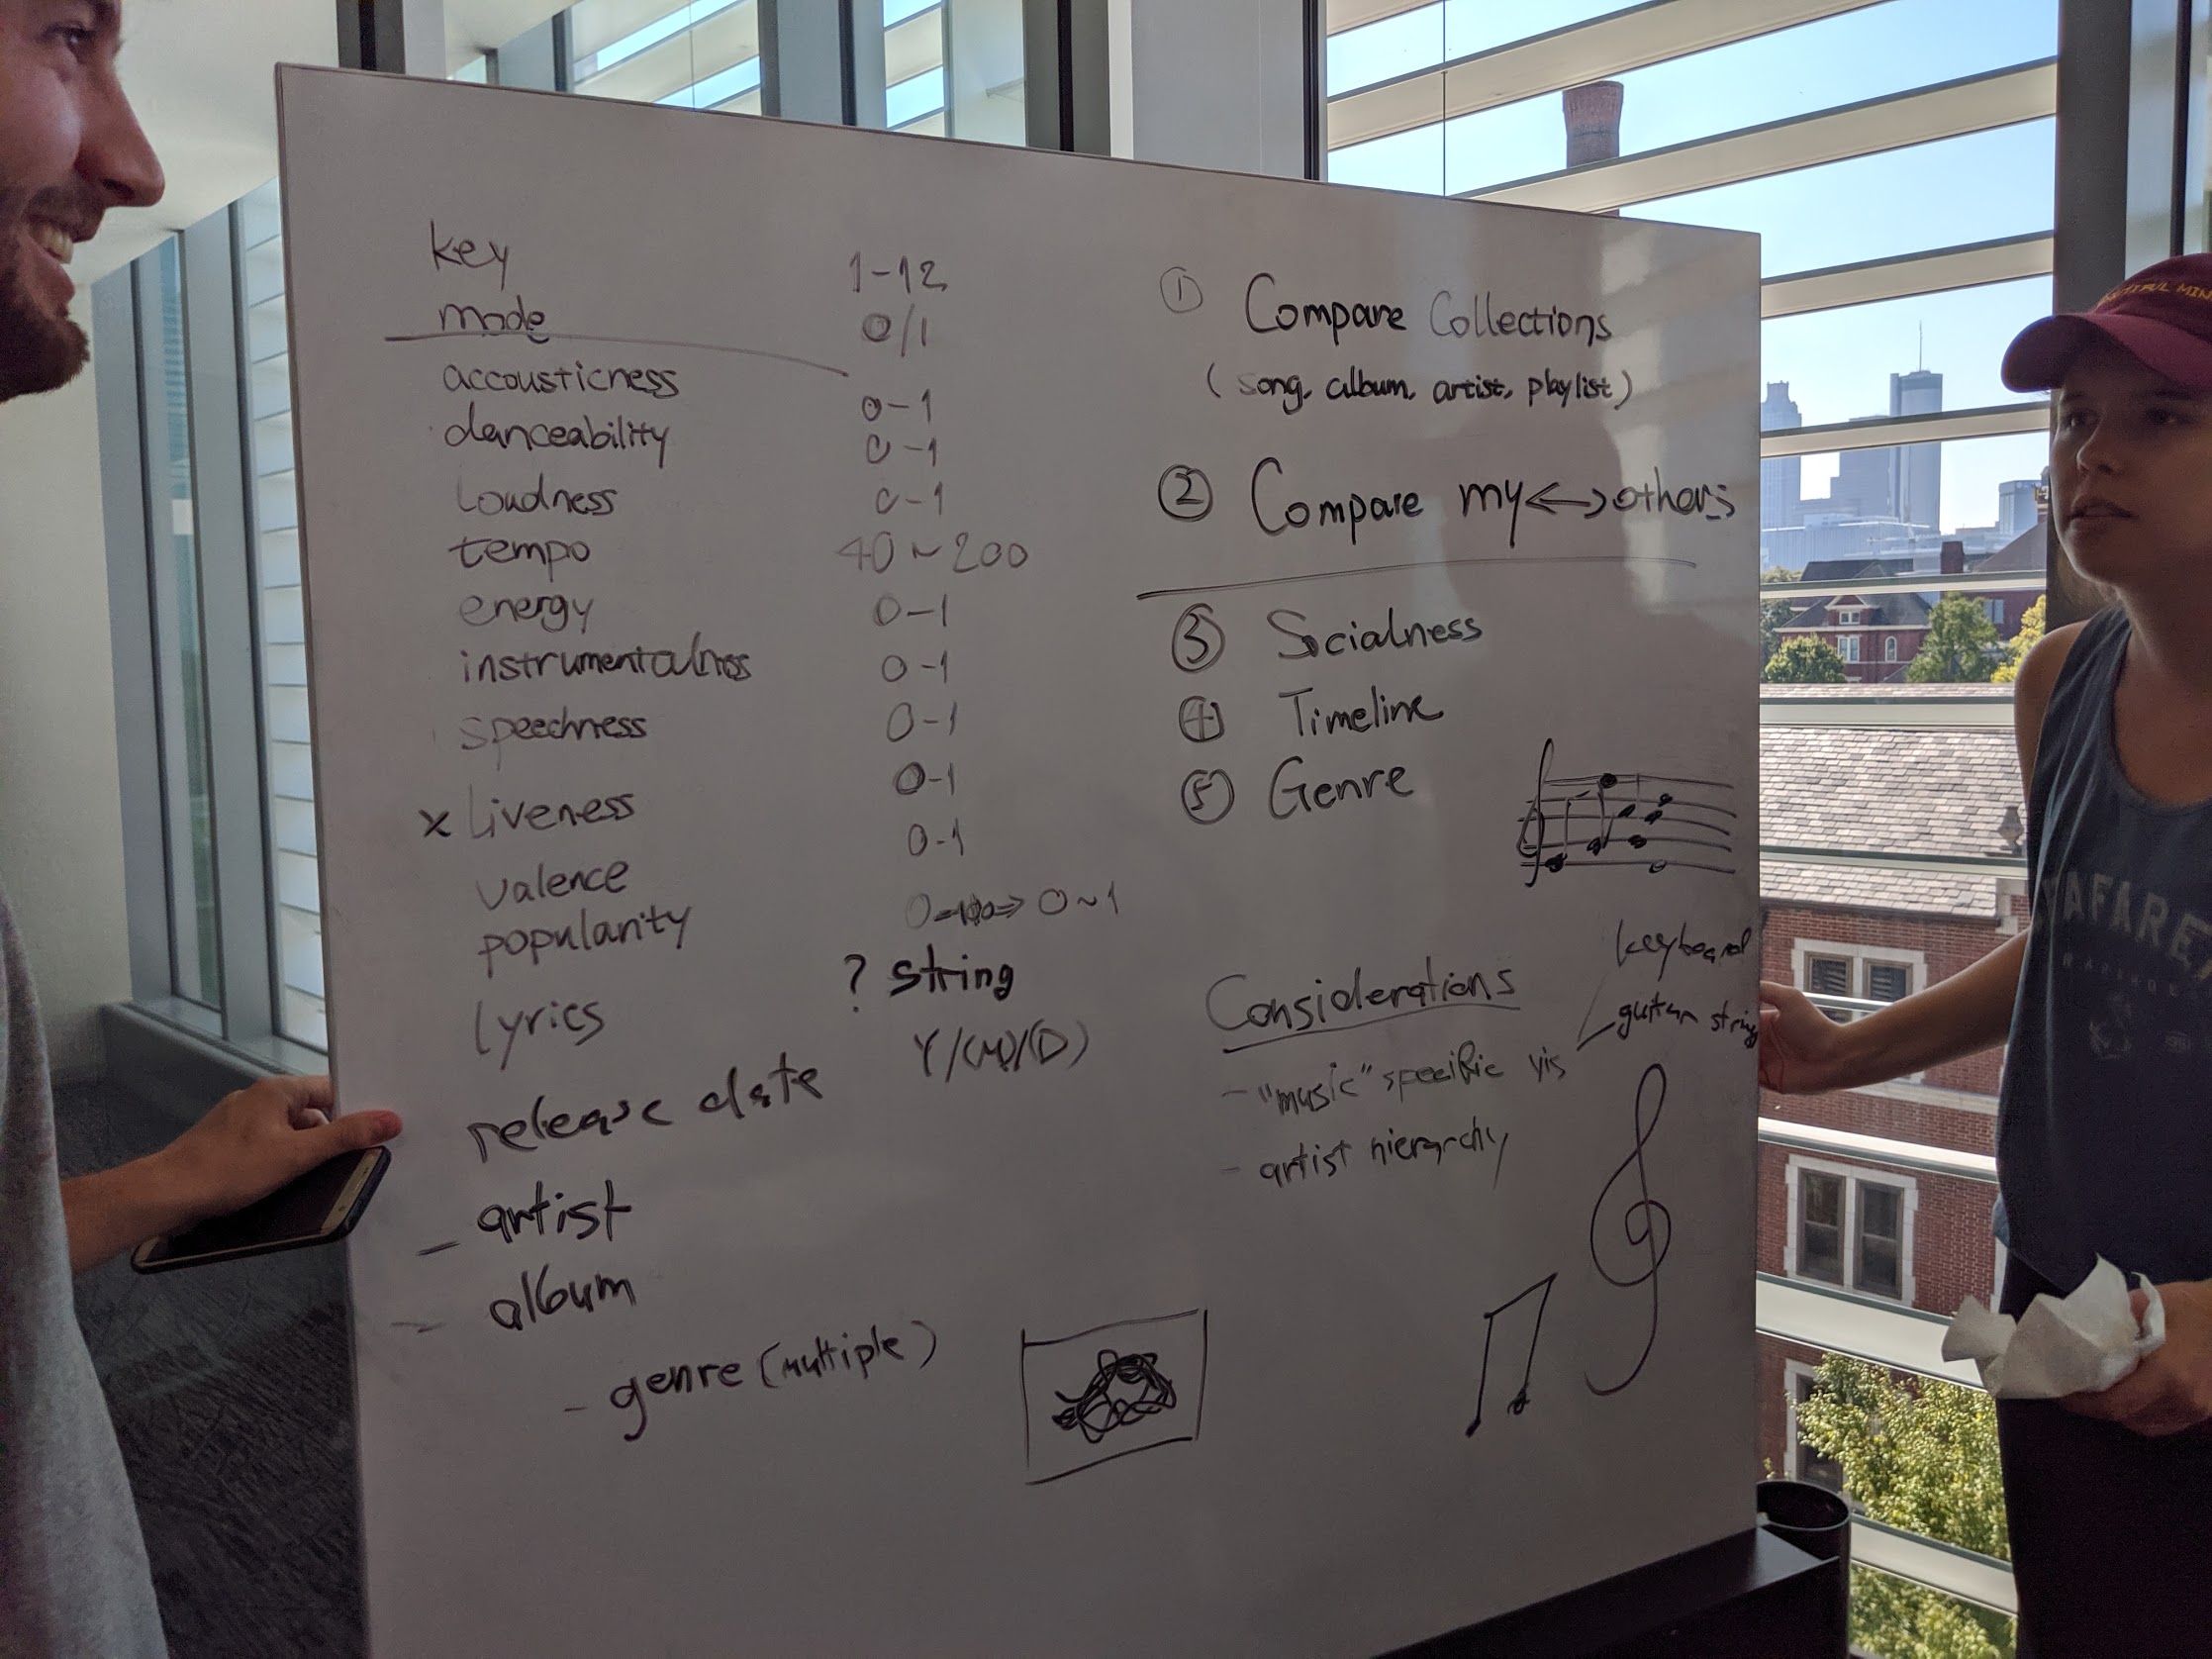
Brainstorming & Sketching
Once we understood more about the problem domain, we proceeded with a brainstorming session. The brainstorming technique we used started with brainwriting where each person in the team sketches out their ideas on paper, then the group shares their designs and builds on each other's ideas. At the end of the sessions, we then converged to 4 ideas to be prototyped in the 1st iteration.
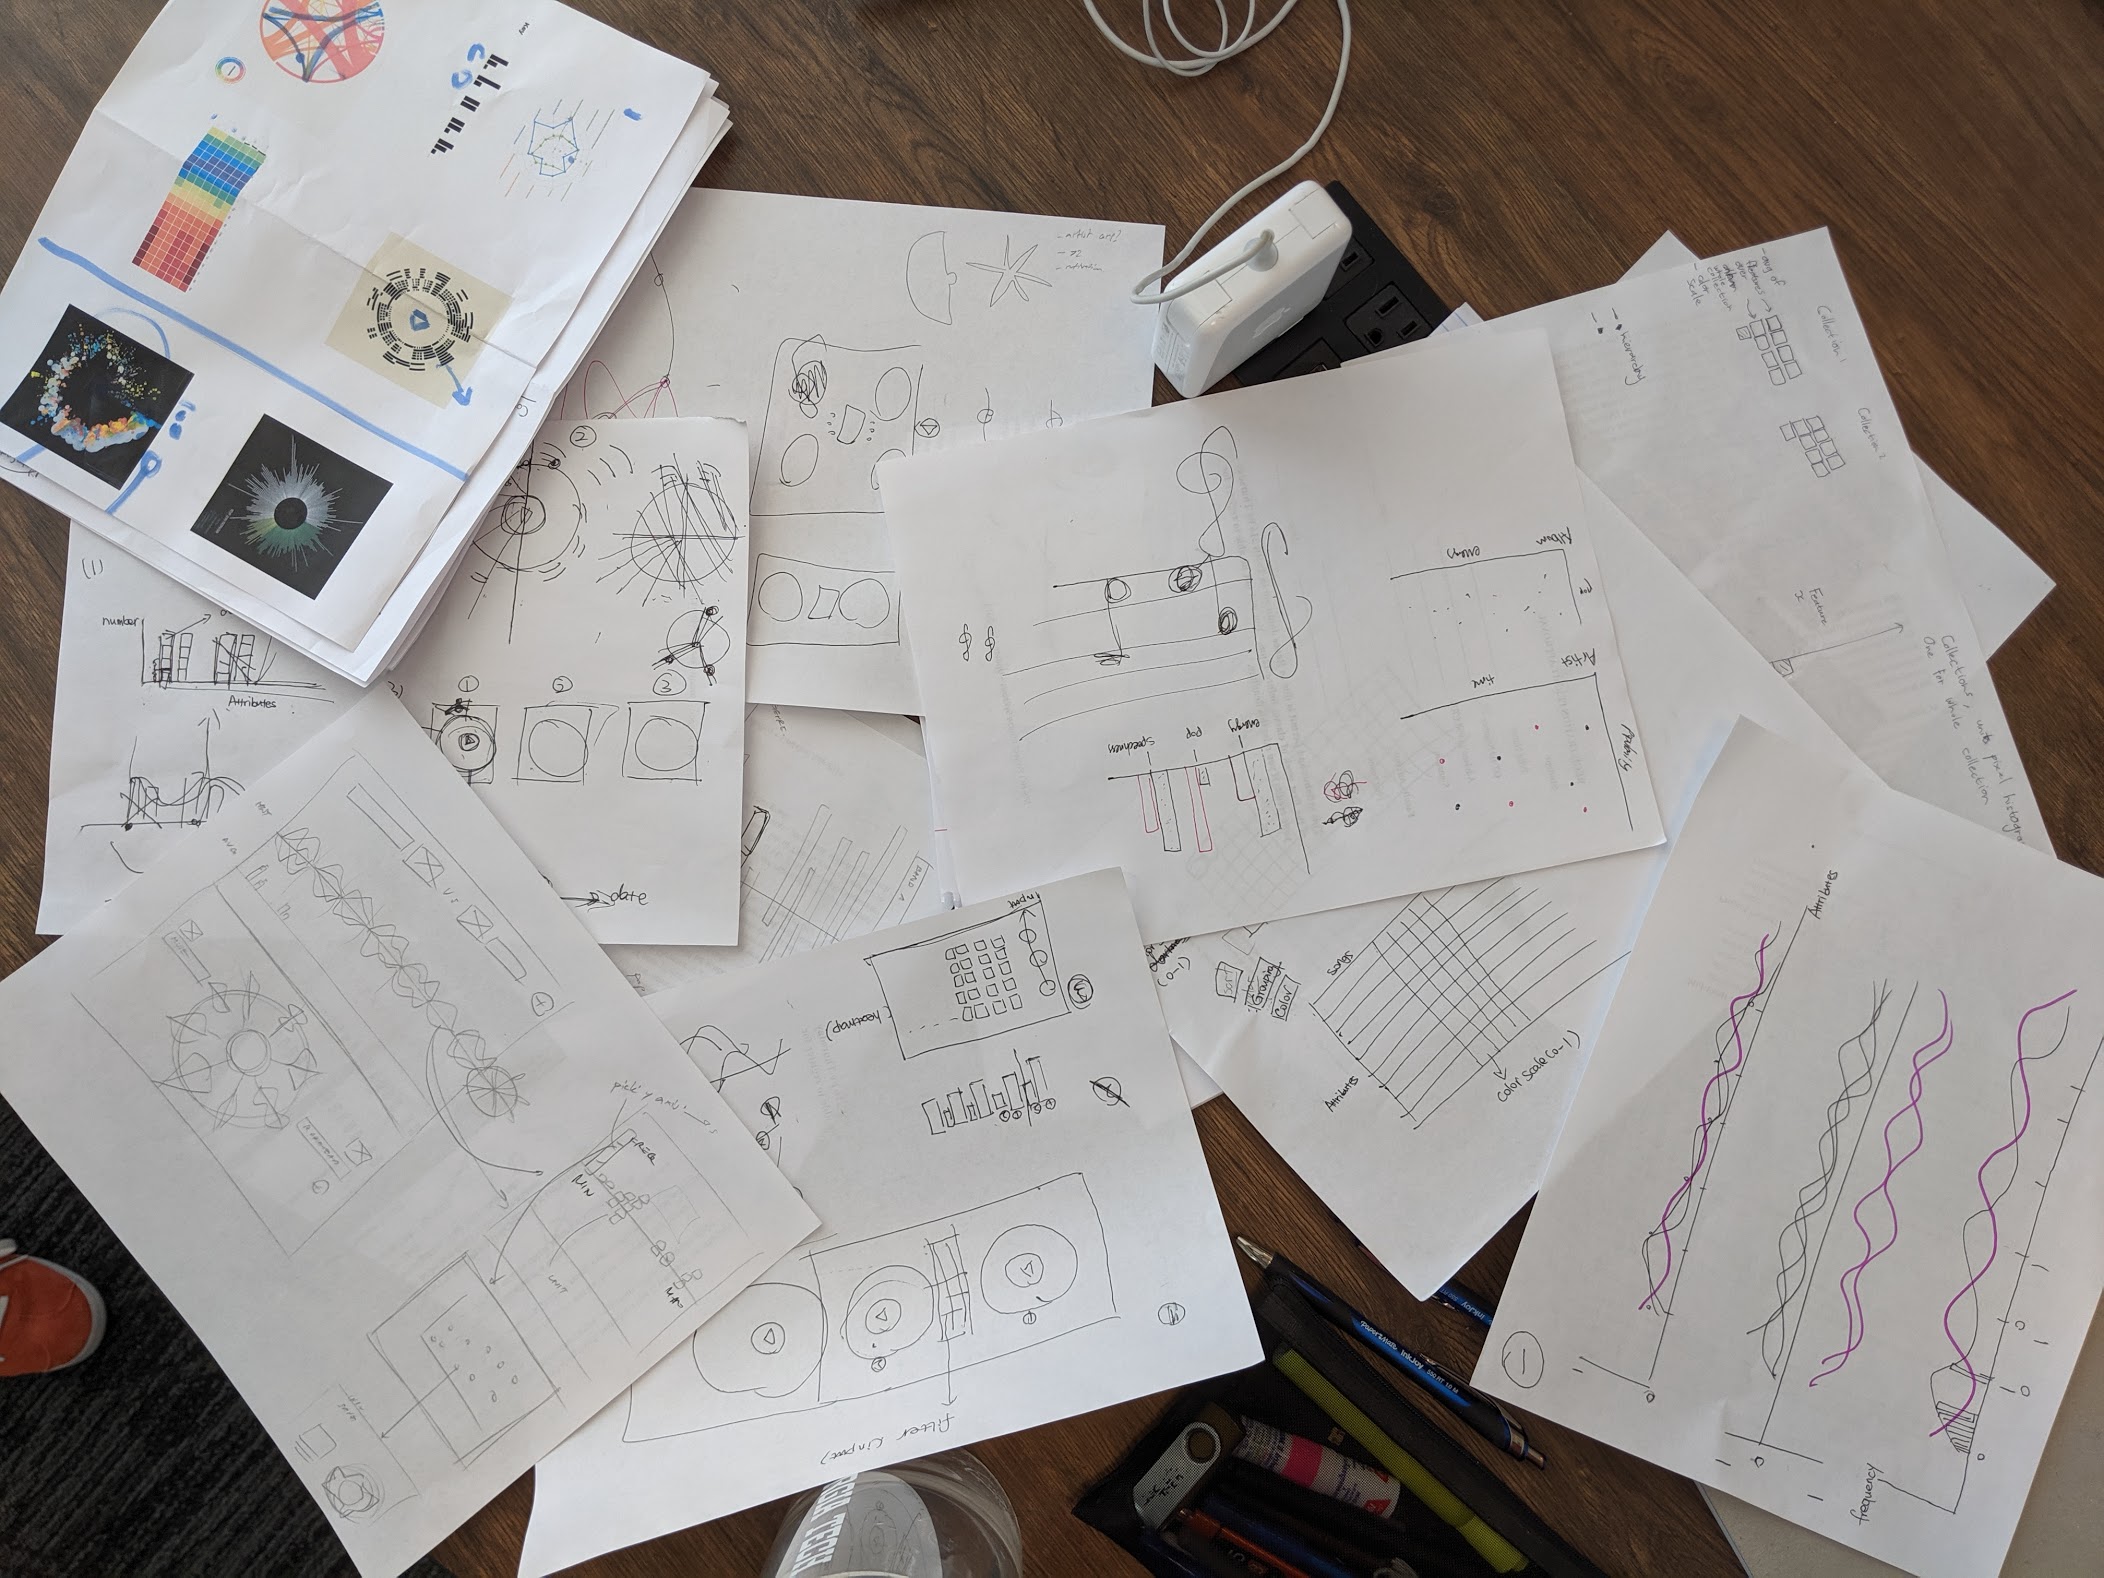
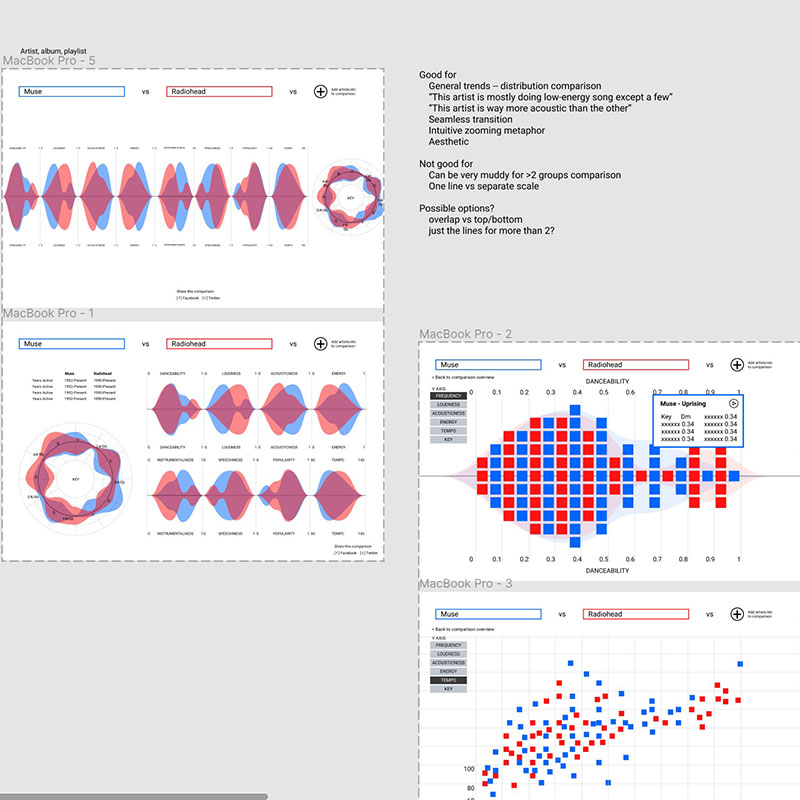
4 Early Designs
Resulting from the brainstorming sessions were four initial design ideas with different ways of visualizing the Spotify data.
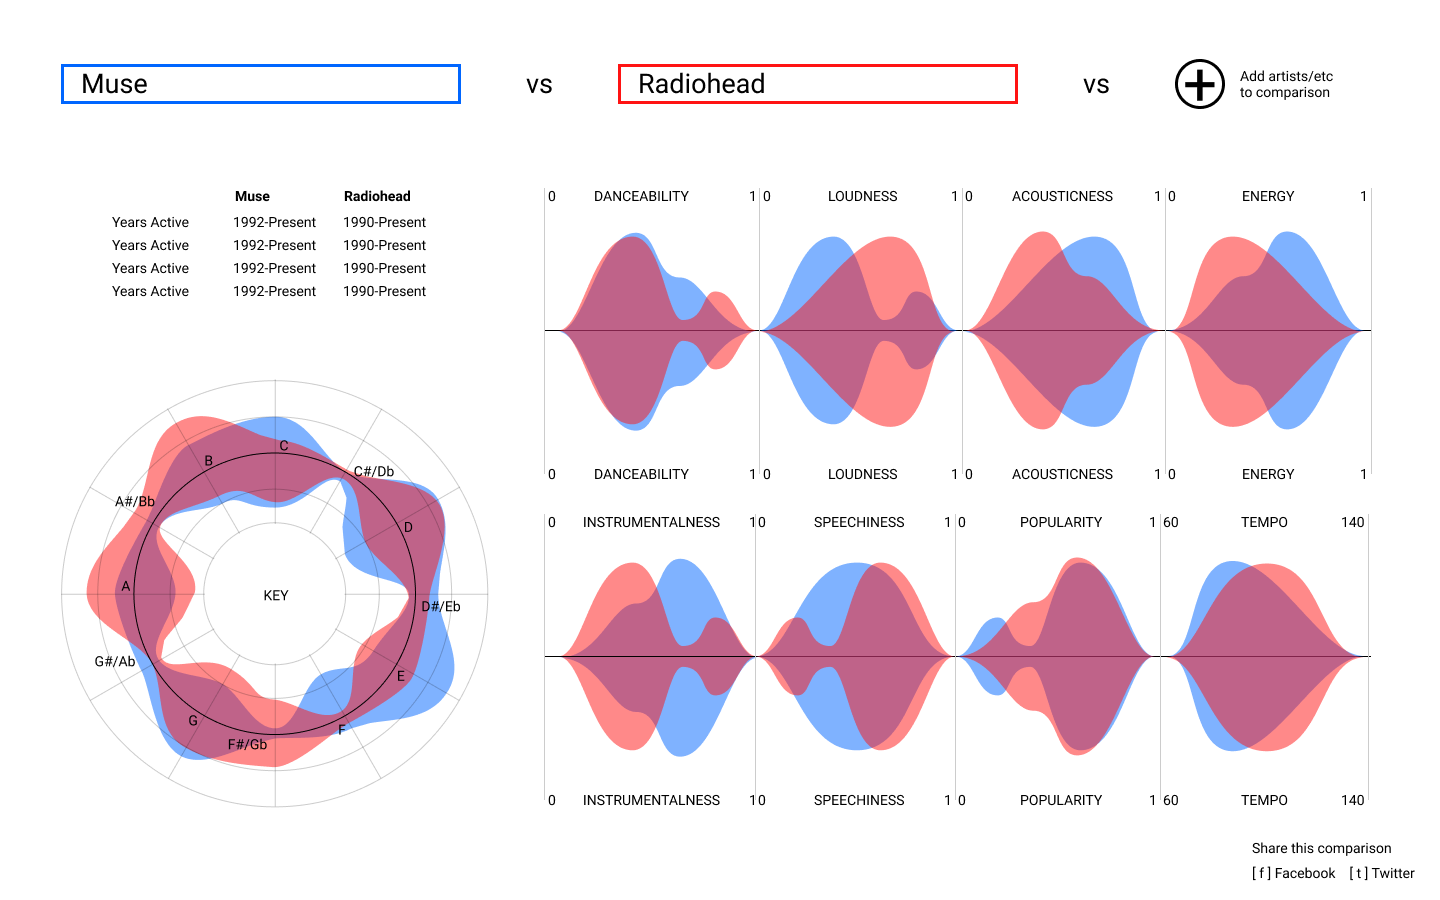
Idea #1
Smooth histogram-based visualization, inspired by the "sound wave" shape, showing the distribution of each attribute which reveals scatterplots in detail views.
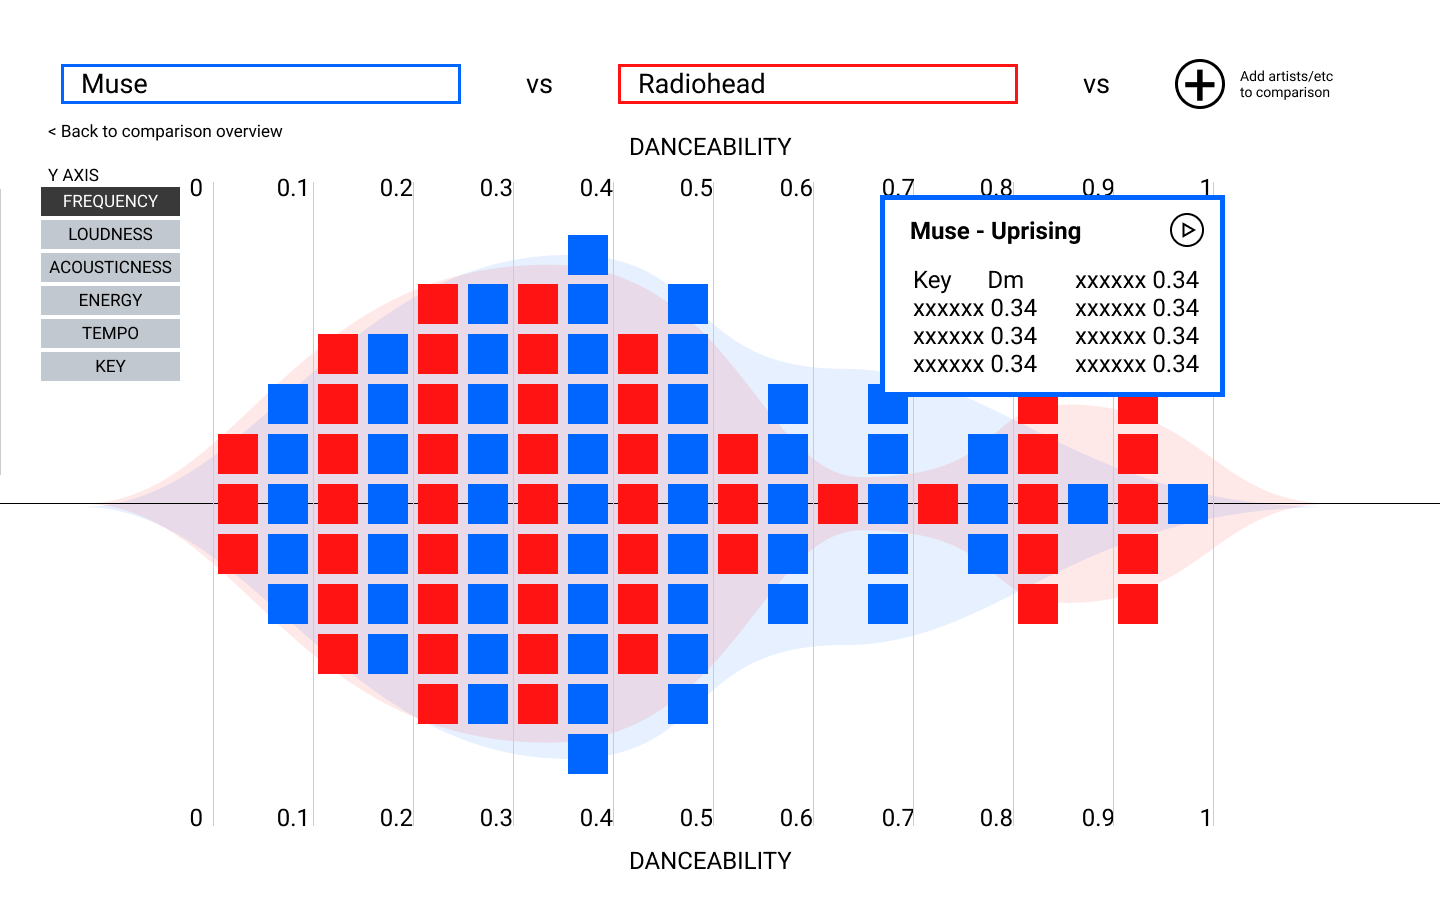
Idea #2
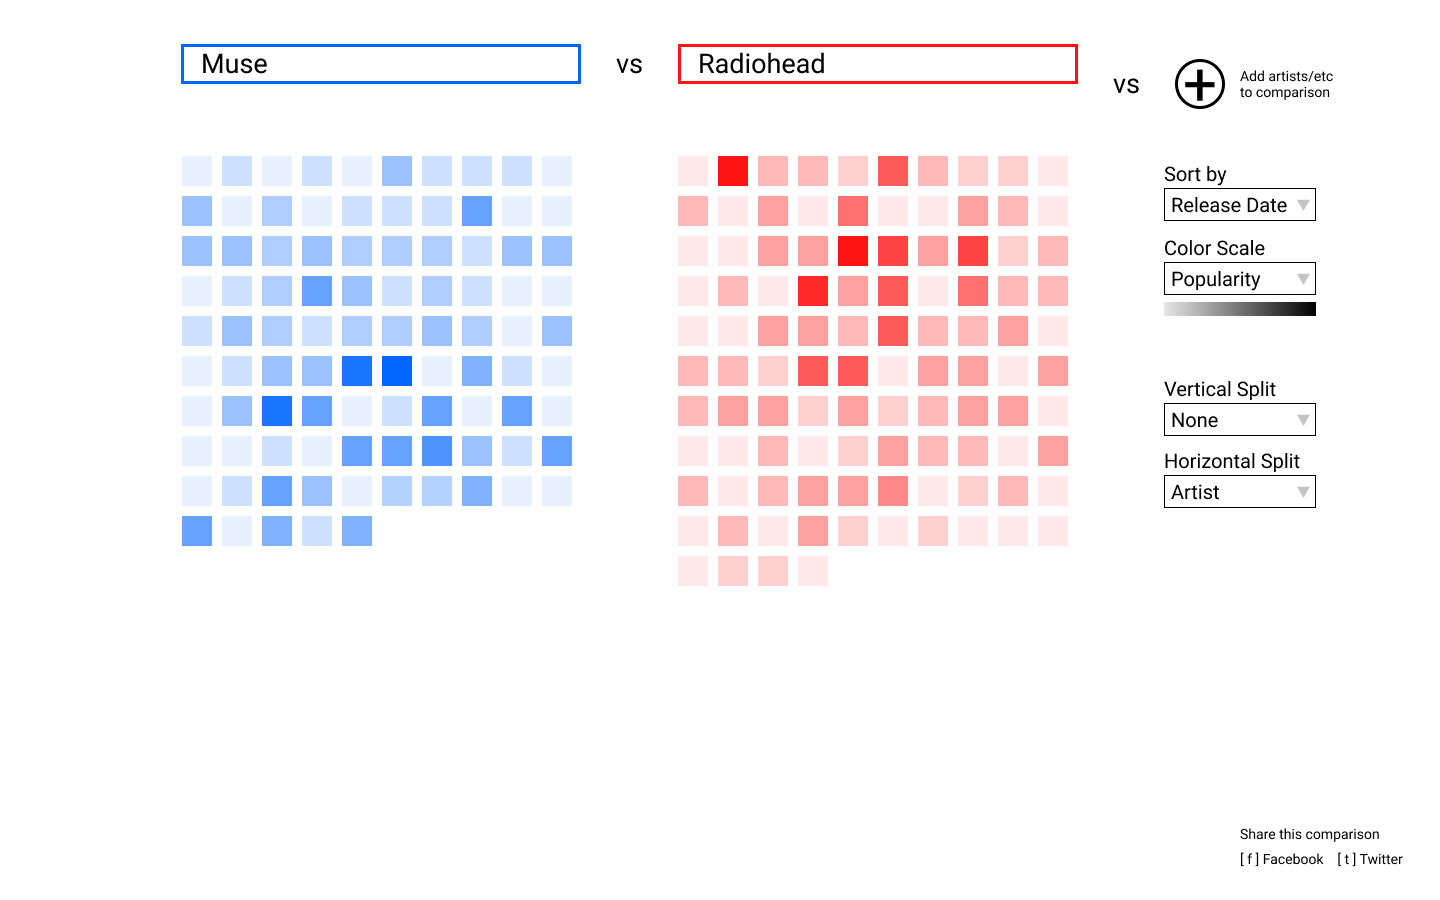
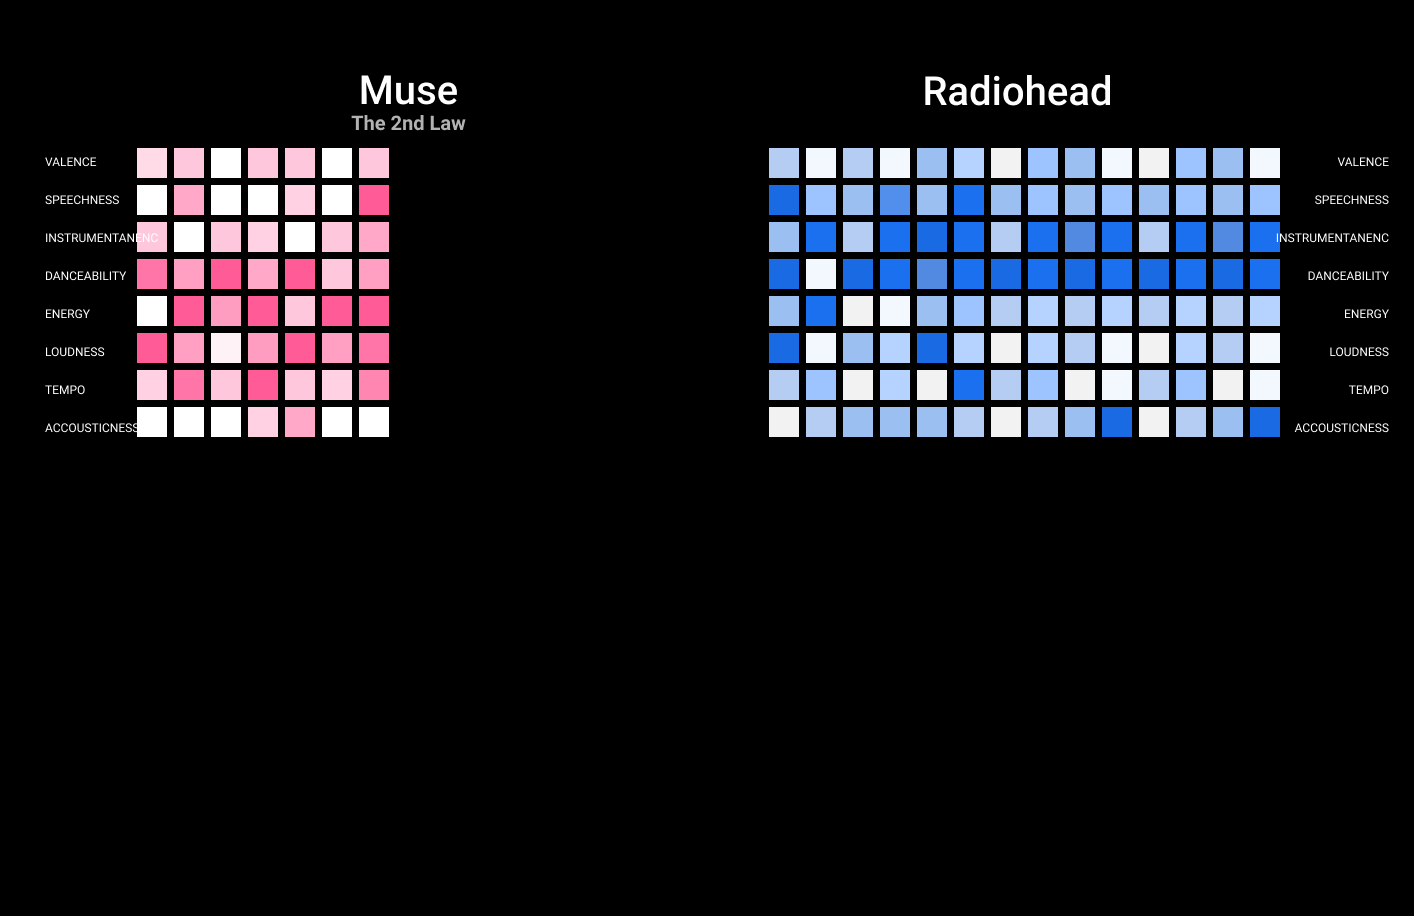
Grid-based unit visualization where each block represents a song and is arranged, colored, and "split" by user-selected attributes.
Idea #3
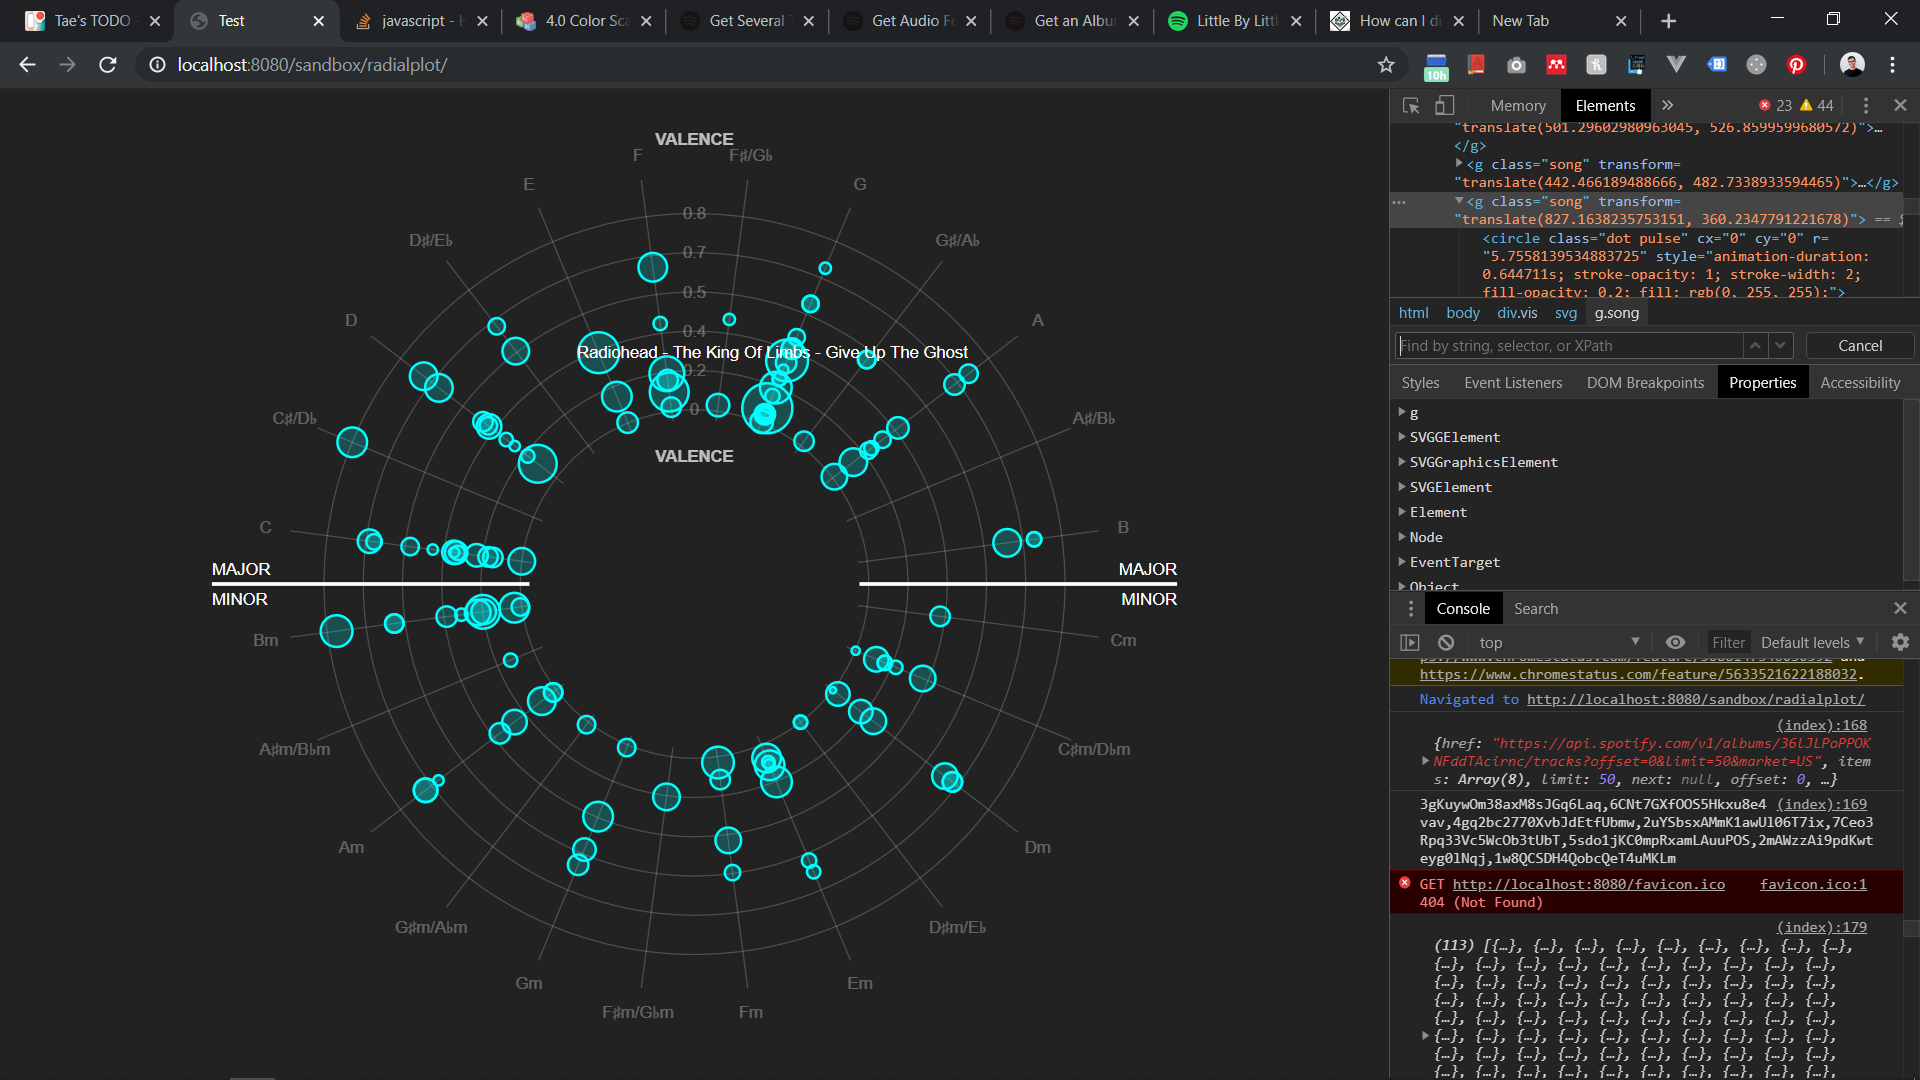
Vinyl-record inspired visualization showing the distribution of each attribute by the color of each segment. Audio preview of a selected song can also be played.

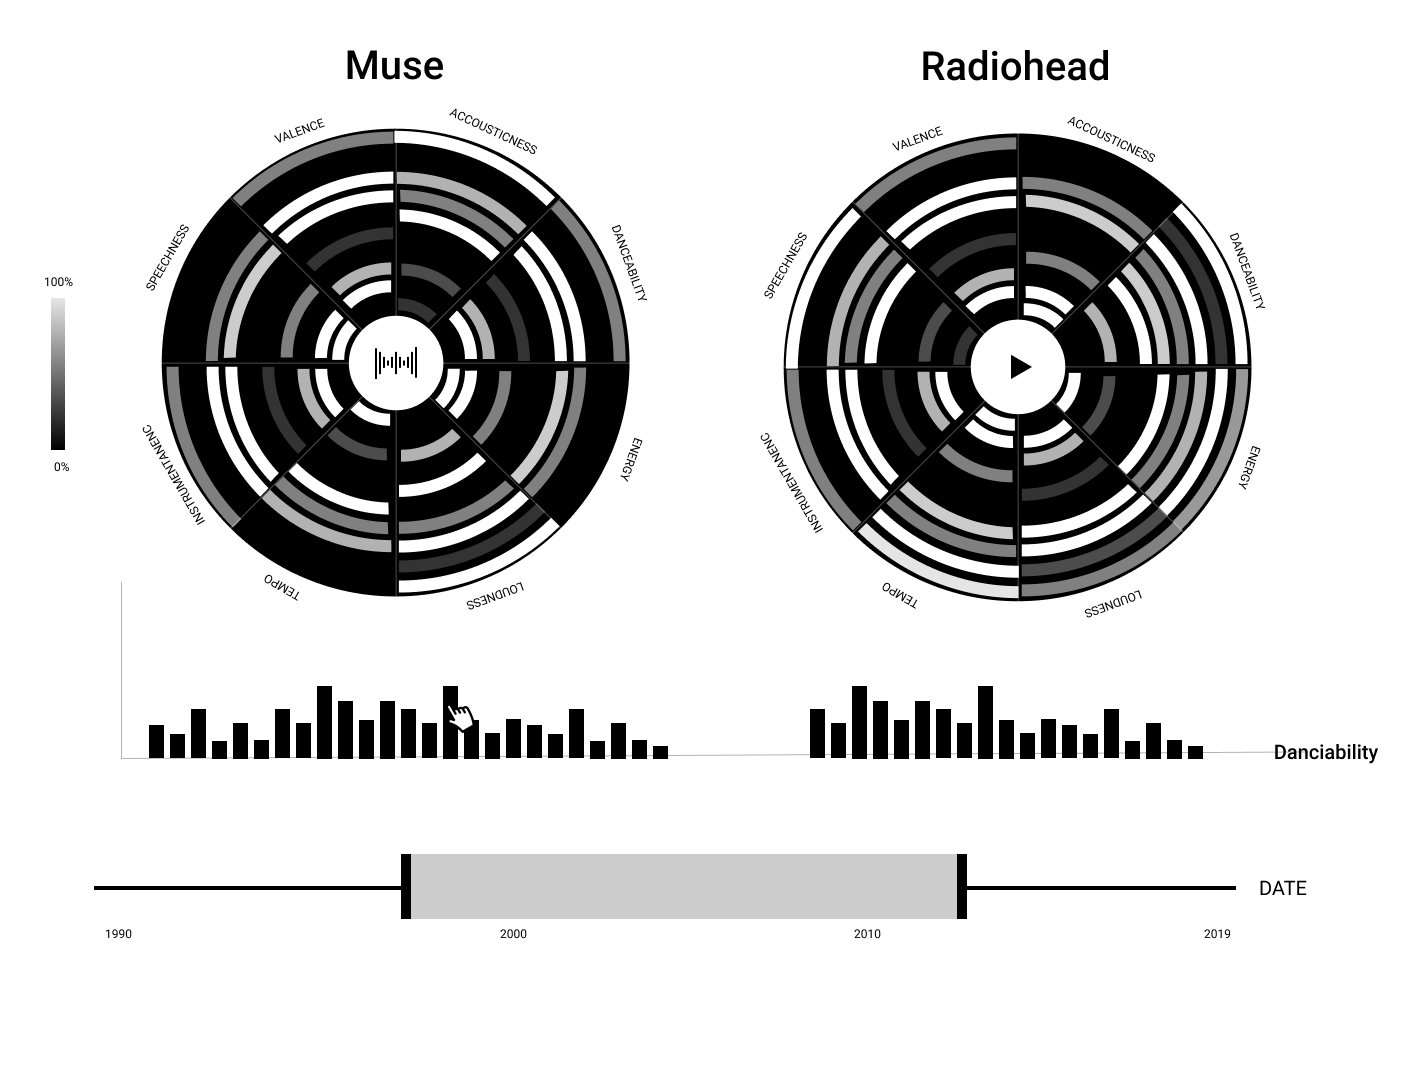
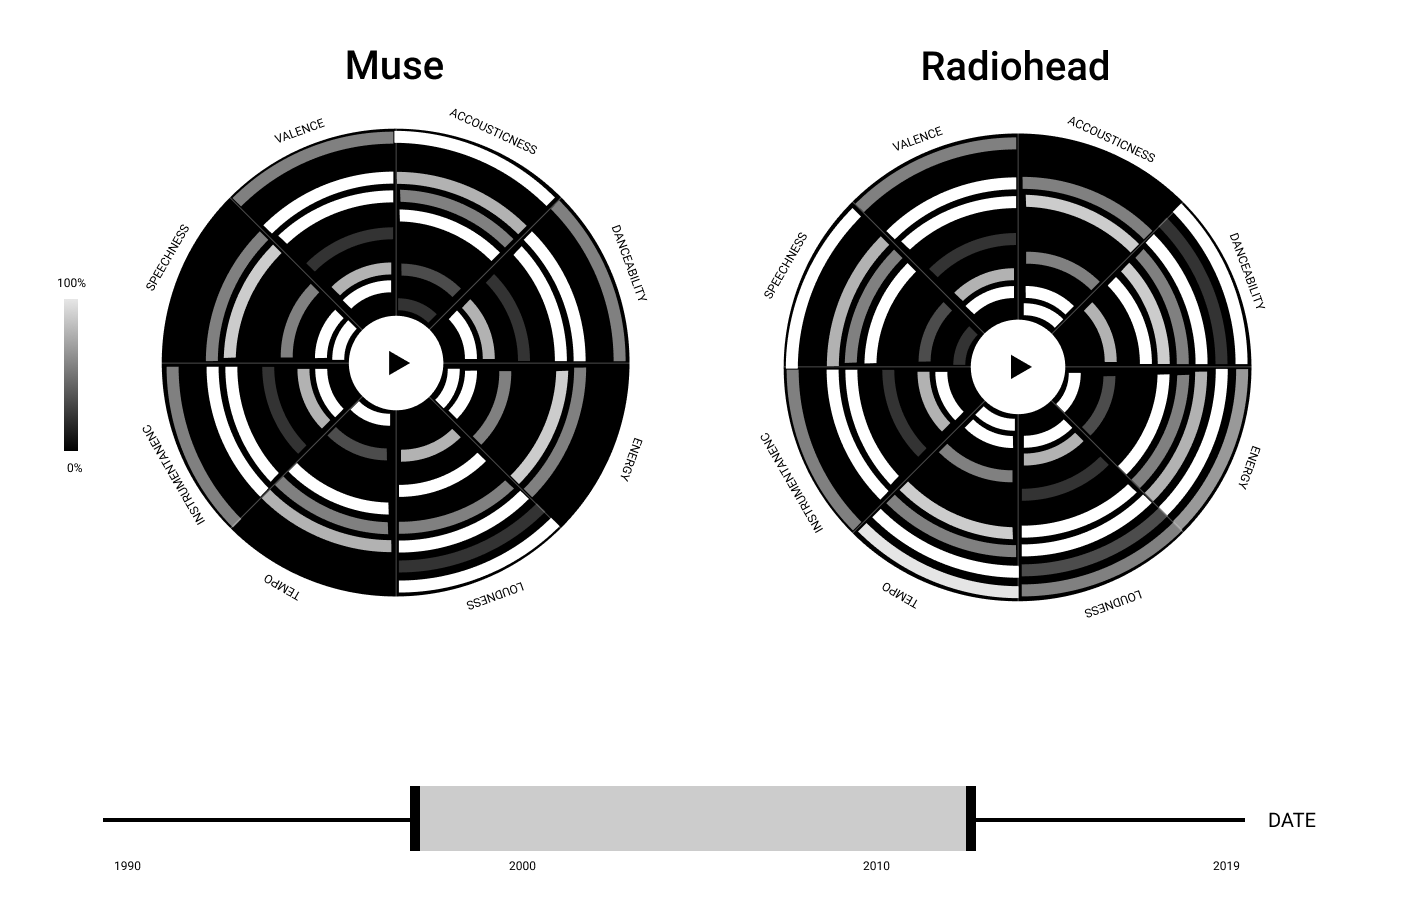
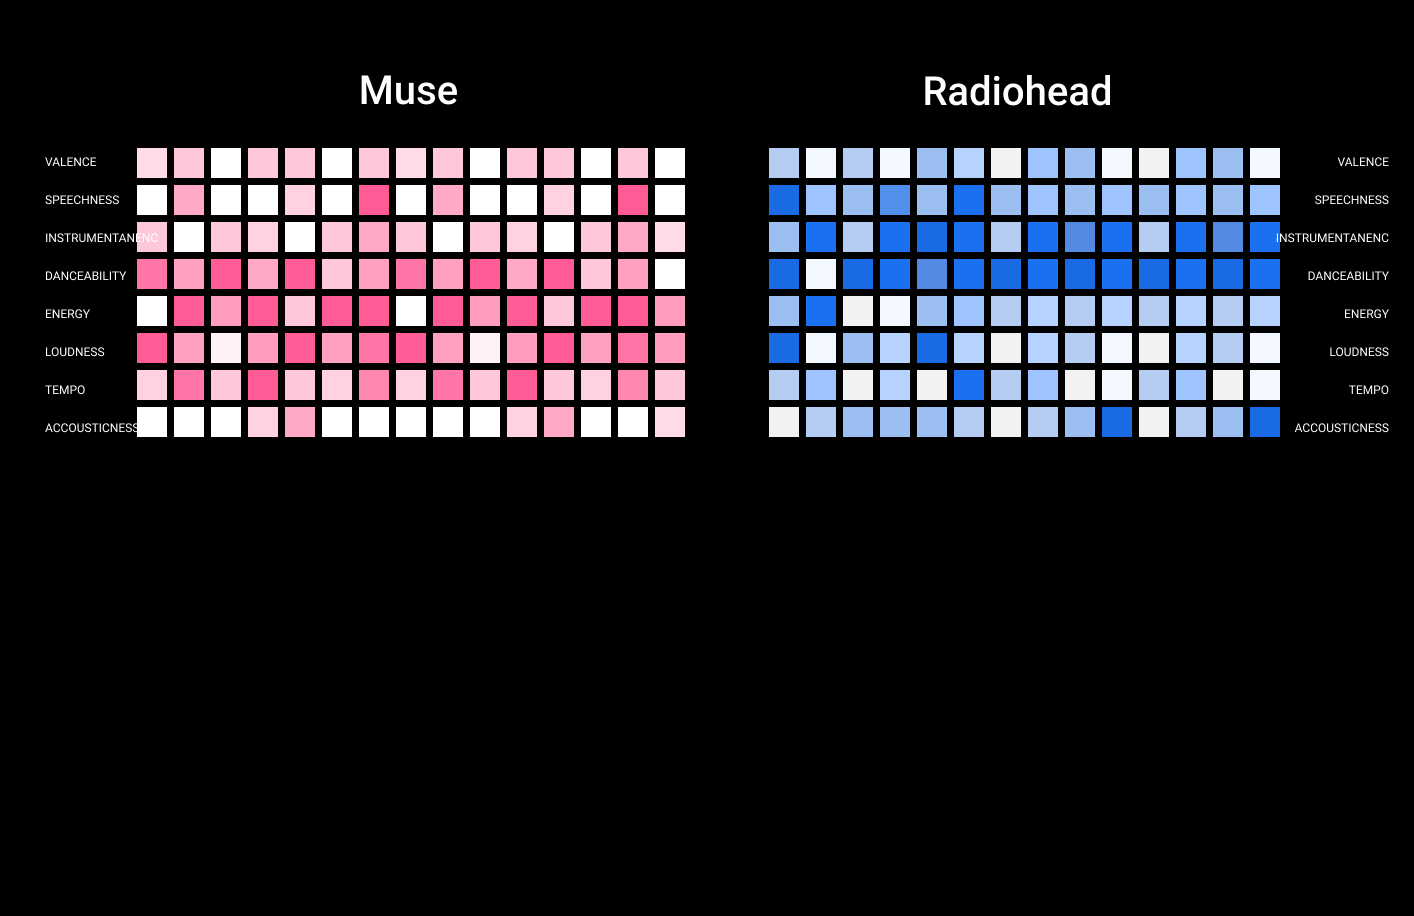
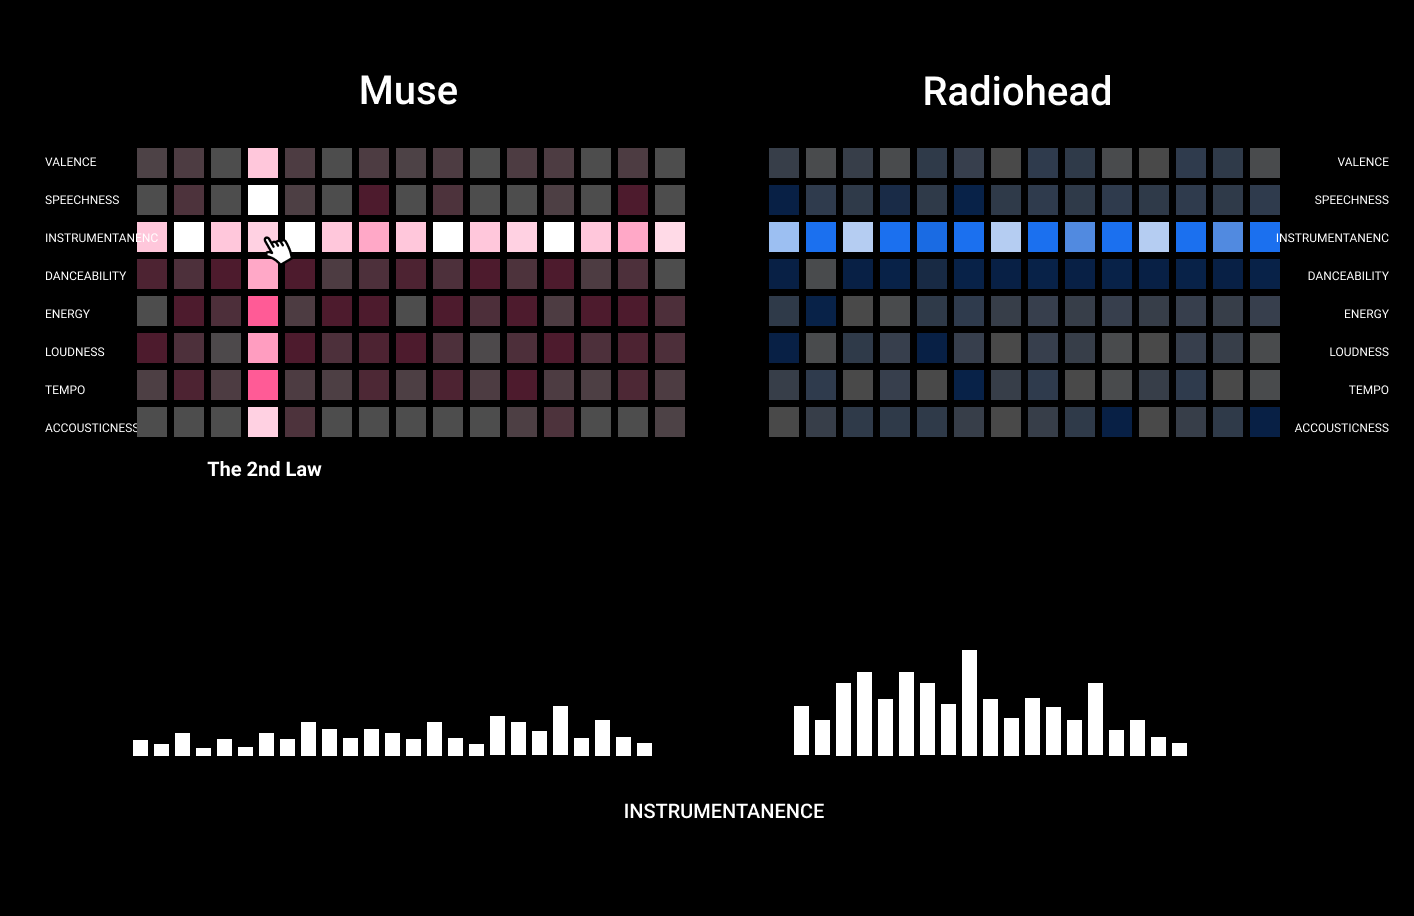
Idea #4
Grid-based visualization where one song is represented by one column instead of one square. The color of a square represents each attribute of an associated song.
Design Feedback
Dr. John Stasko and other teaching assistants of the Information Visualization class helped giving expert feedback on our designs. The themes of the feedback that we can improve the design on were:
Feedback
- Focus more on making the visualization easier to understand quickly for people with not much music background and graphical literacy. Idea #2 was the best at doing this due to its simplicity.
- Push toward wider user tasks other than comparison such as discovering new songs and learning more about one particular artist.
- These designs did not require a lot of screen space. There are opportunities to provide more information through linked views for a smoother experience.
Approaches for Addressing the Issues
- Leverage the easy-to-explain nature of unit visualizations. For example, "one circle is one song," is easier to understand than a histogram.
- Expand the feature set of the design to cover tasks such as music discovery.
- Provide help tooltips and quick tutorials for users to explain the visualization.
- Combine these design ideas to create linked views.
2nd Design Iteration
Features, Revisited
After getting feedback, we revised the design based on the approaches listed above. We started by expanding the feature set to provide more value to users. We also gravitated towards focusing on comparisons between artists, instead of any music collections, to provide a more coherent and simple experience to the users, as well as lower complexity for development.
The expanded set of functionalities are as follows:
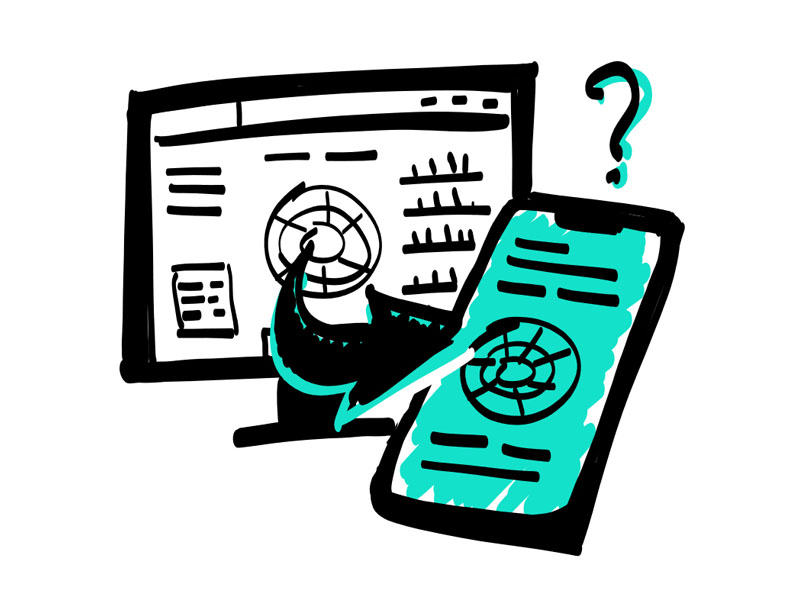
In retrospect, we should have focused more on mobile-first visualization design from early on. Though desktop-based visualization gives a much richer experience, a significant portion of our user group would use it more on mobile devices.
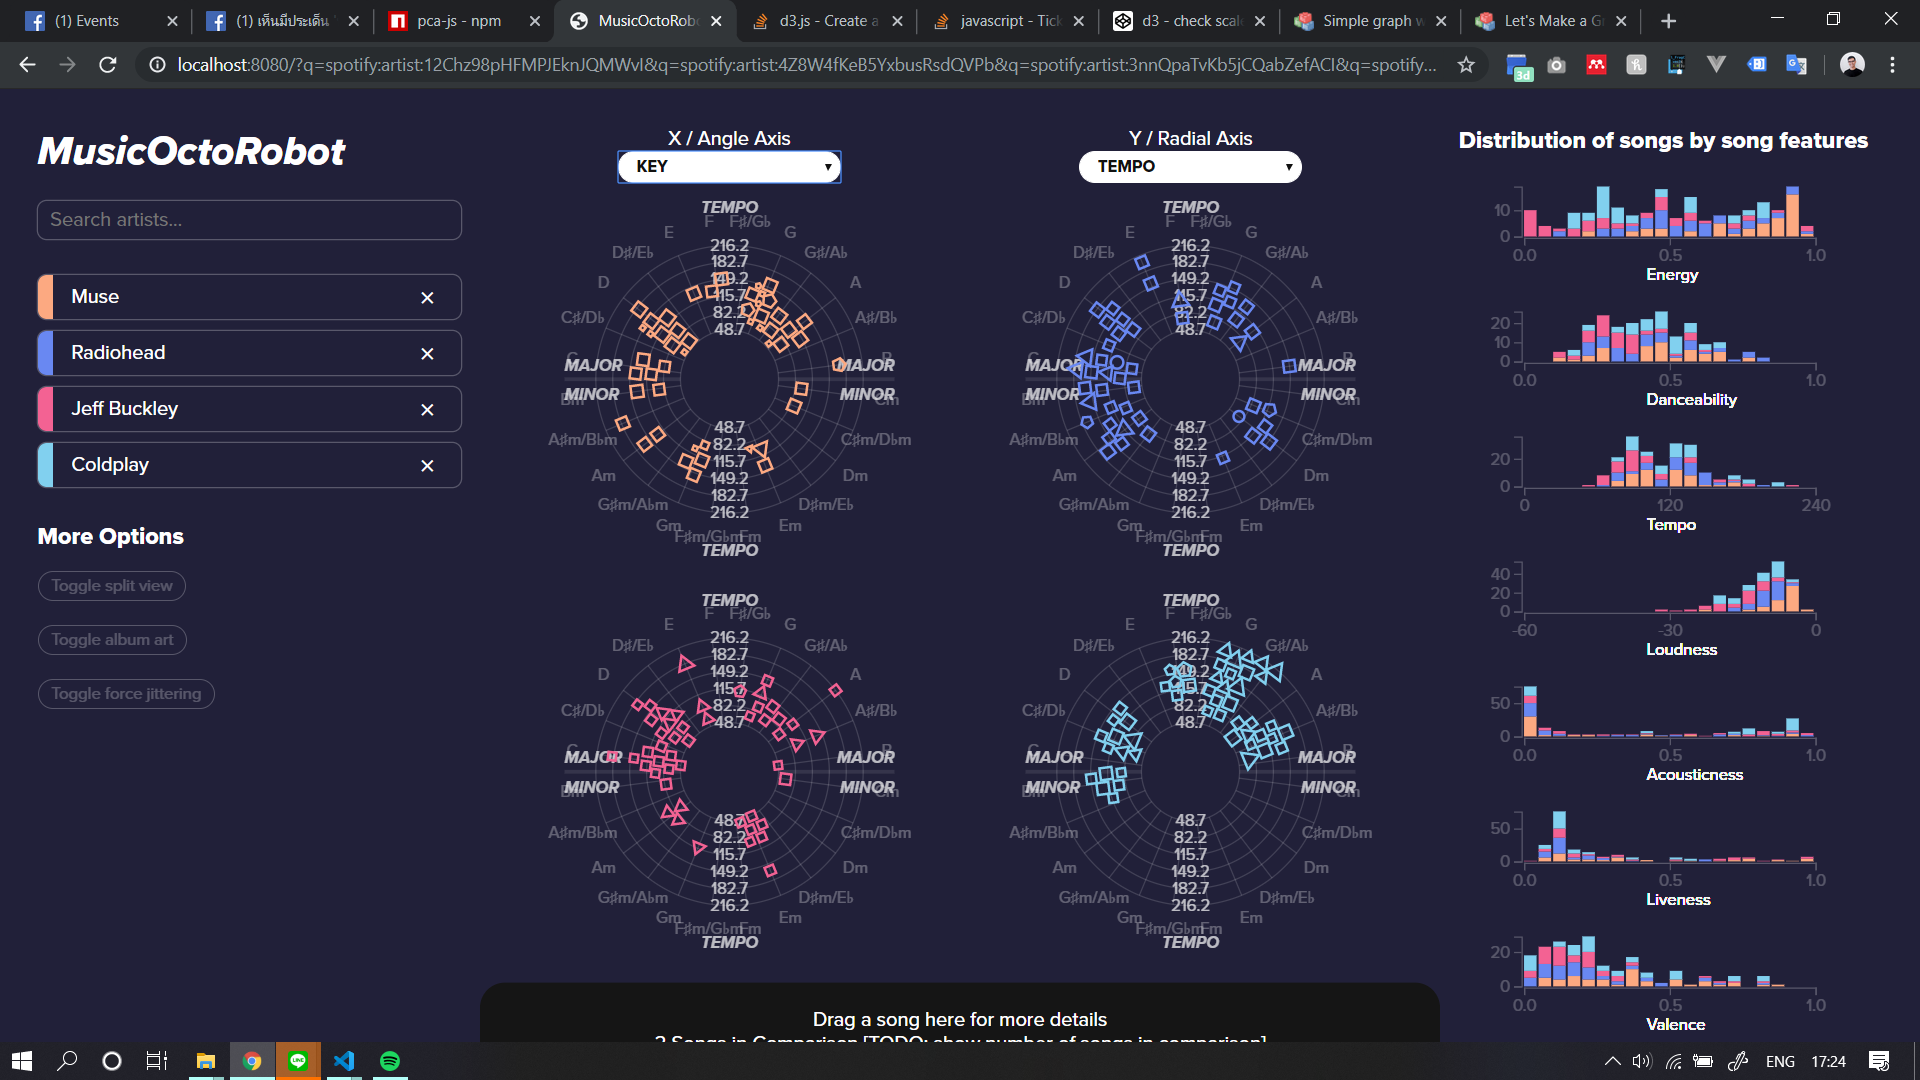
1. Artist Comparison
We scoped down our project from comparing between any collections of music to only allow artist-to-artist comparison in the main view and song-by-song comparison in the detail view.
2. Exploring an Artist in Detail
Although some of the previous designs already allowed users to pick only one artist to perform an analysis, we decided to escalate it into one of our main considerations and try to design views that work well both with only one artist as well as for comparisons.
3. Discovering New Music
(From the Selected Artists)
It's common for music listeners to only listen to a few songs from an artist and missing out on other songs from that artist that they might also like. With the data about the selected artists, we can offer suggestions to songs that are similar to what the users are interested in.
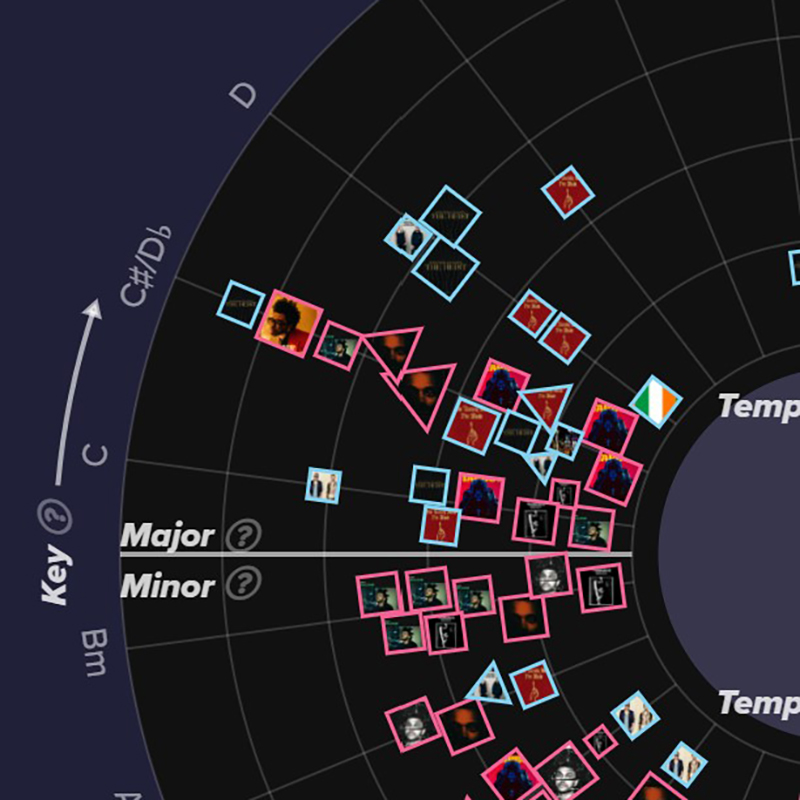
New Design
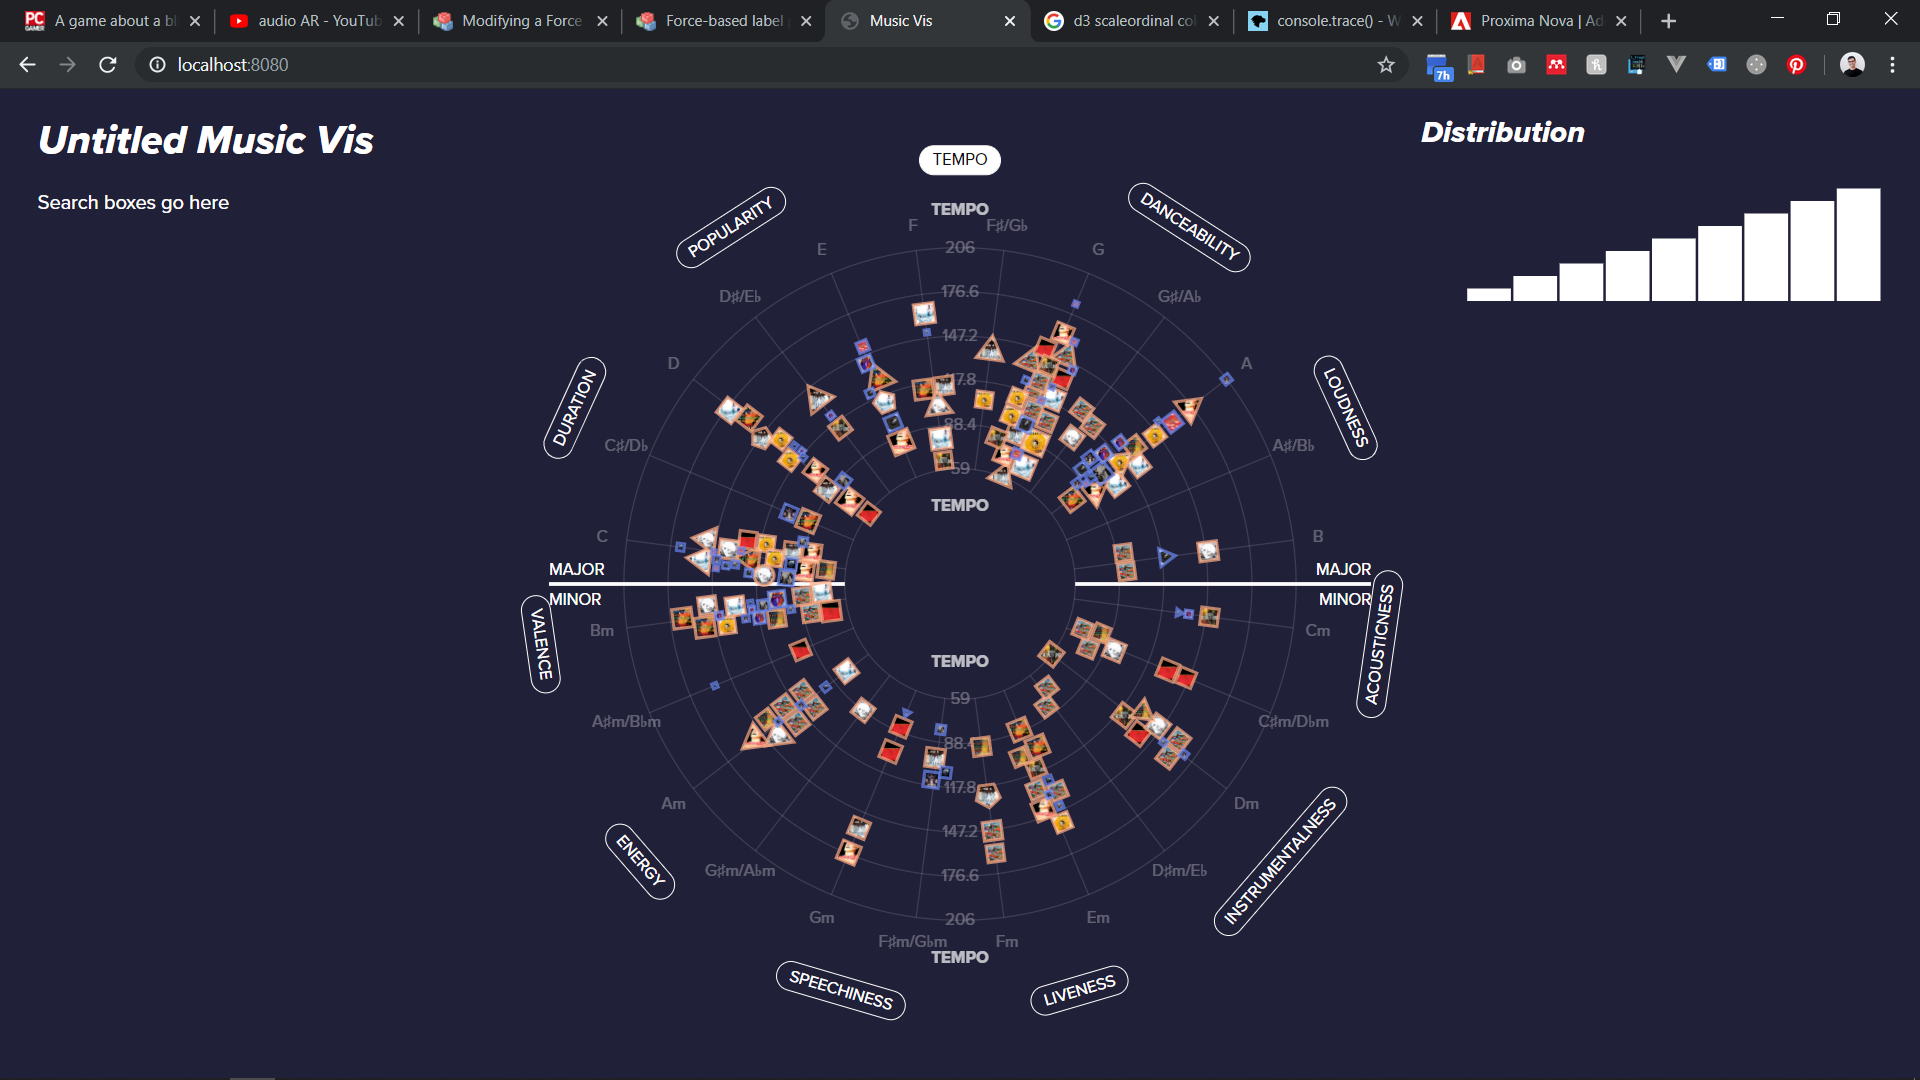
We created another medium-fidelity prototype before we started developing the visualization. The new design featured a single main scatter plot-/unit visualization-based view in the middle with auxiliary histograms views that doubles as a dynamic query filter. Data from multiple selected artists will be shown in the same view, making the design work for both single and multiple artists.
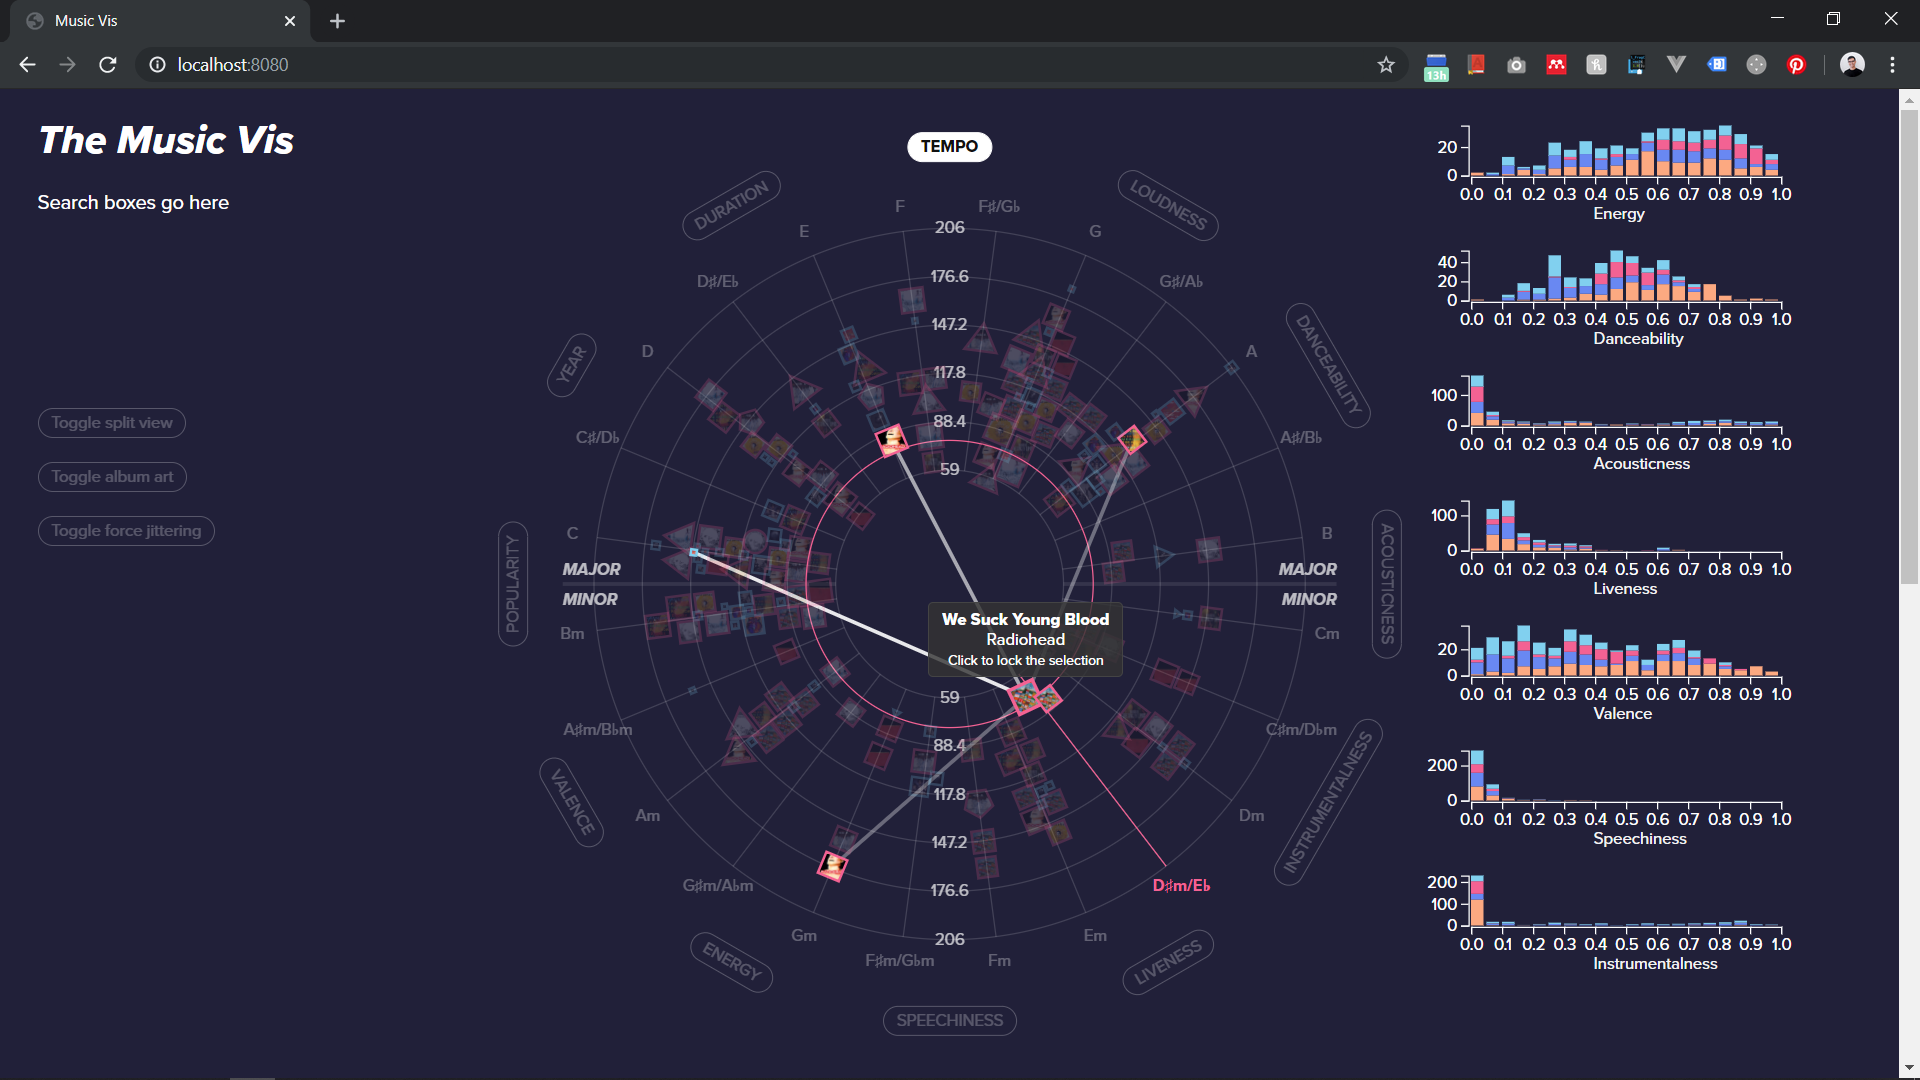
We also added recommendations to the visualization. When a user hovers the cursor on a data point, lines will be drawn from that song to other similar ones. This would help users discover songs that are similar to their favorites.
We also designed detailed views to allow users to do song-by-song comparisons. We chose the second design over the first because it gives a more casual and "cool" look which would appeal to broader audiences, fulfilling our design goal.
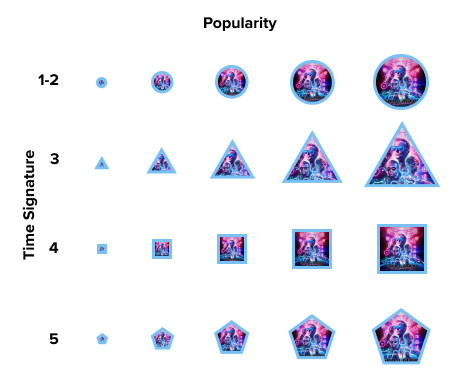
Data Encoding
-
Position — user-selected attributes
The X-Y position is based on 2 user-selected attributes, e.g., danceability, acousticness, or energy. For cyclical attributes such as Key, the angle-radial scale was used. By default, the two attributes are key and tempo since they are standard musical terms that users already associate with music.
-
Area — Popularity
The more popular the song, the bigger the data point. This mapping was chosen to make popular songs stand out more.
-
Border Color — Artist
Signifies different artist selection that the user has chosen.
-
Shape — Time Signature
The time signature was mapped to the number of sides of the data point. Since its value mostly ranges from 3 to 5, it gives a natural mapping.
-
Album Art
Album art is familiar to music fans and will help them locate songs they are interested in.
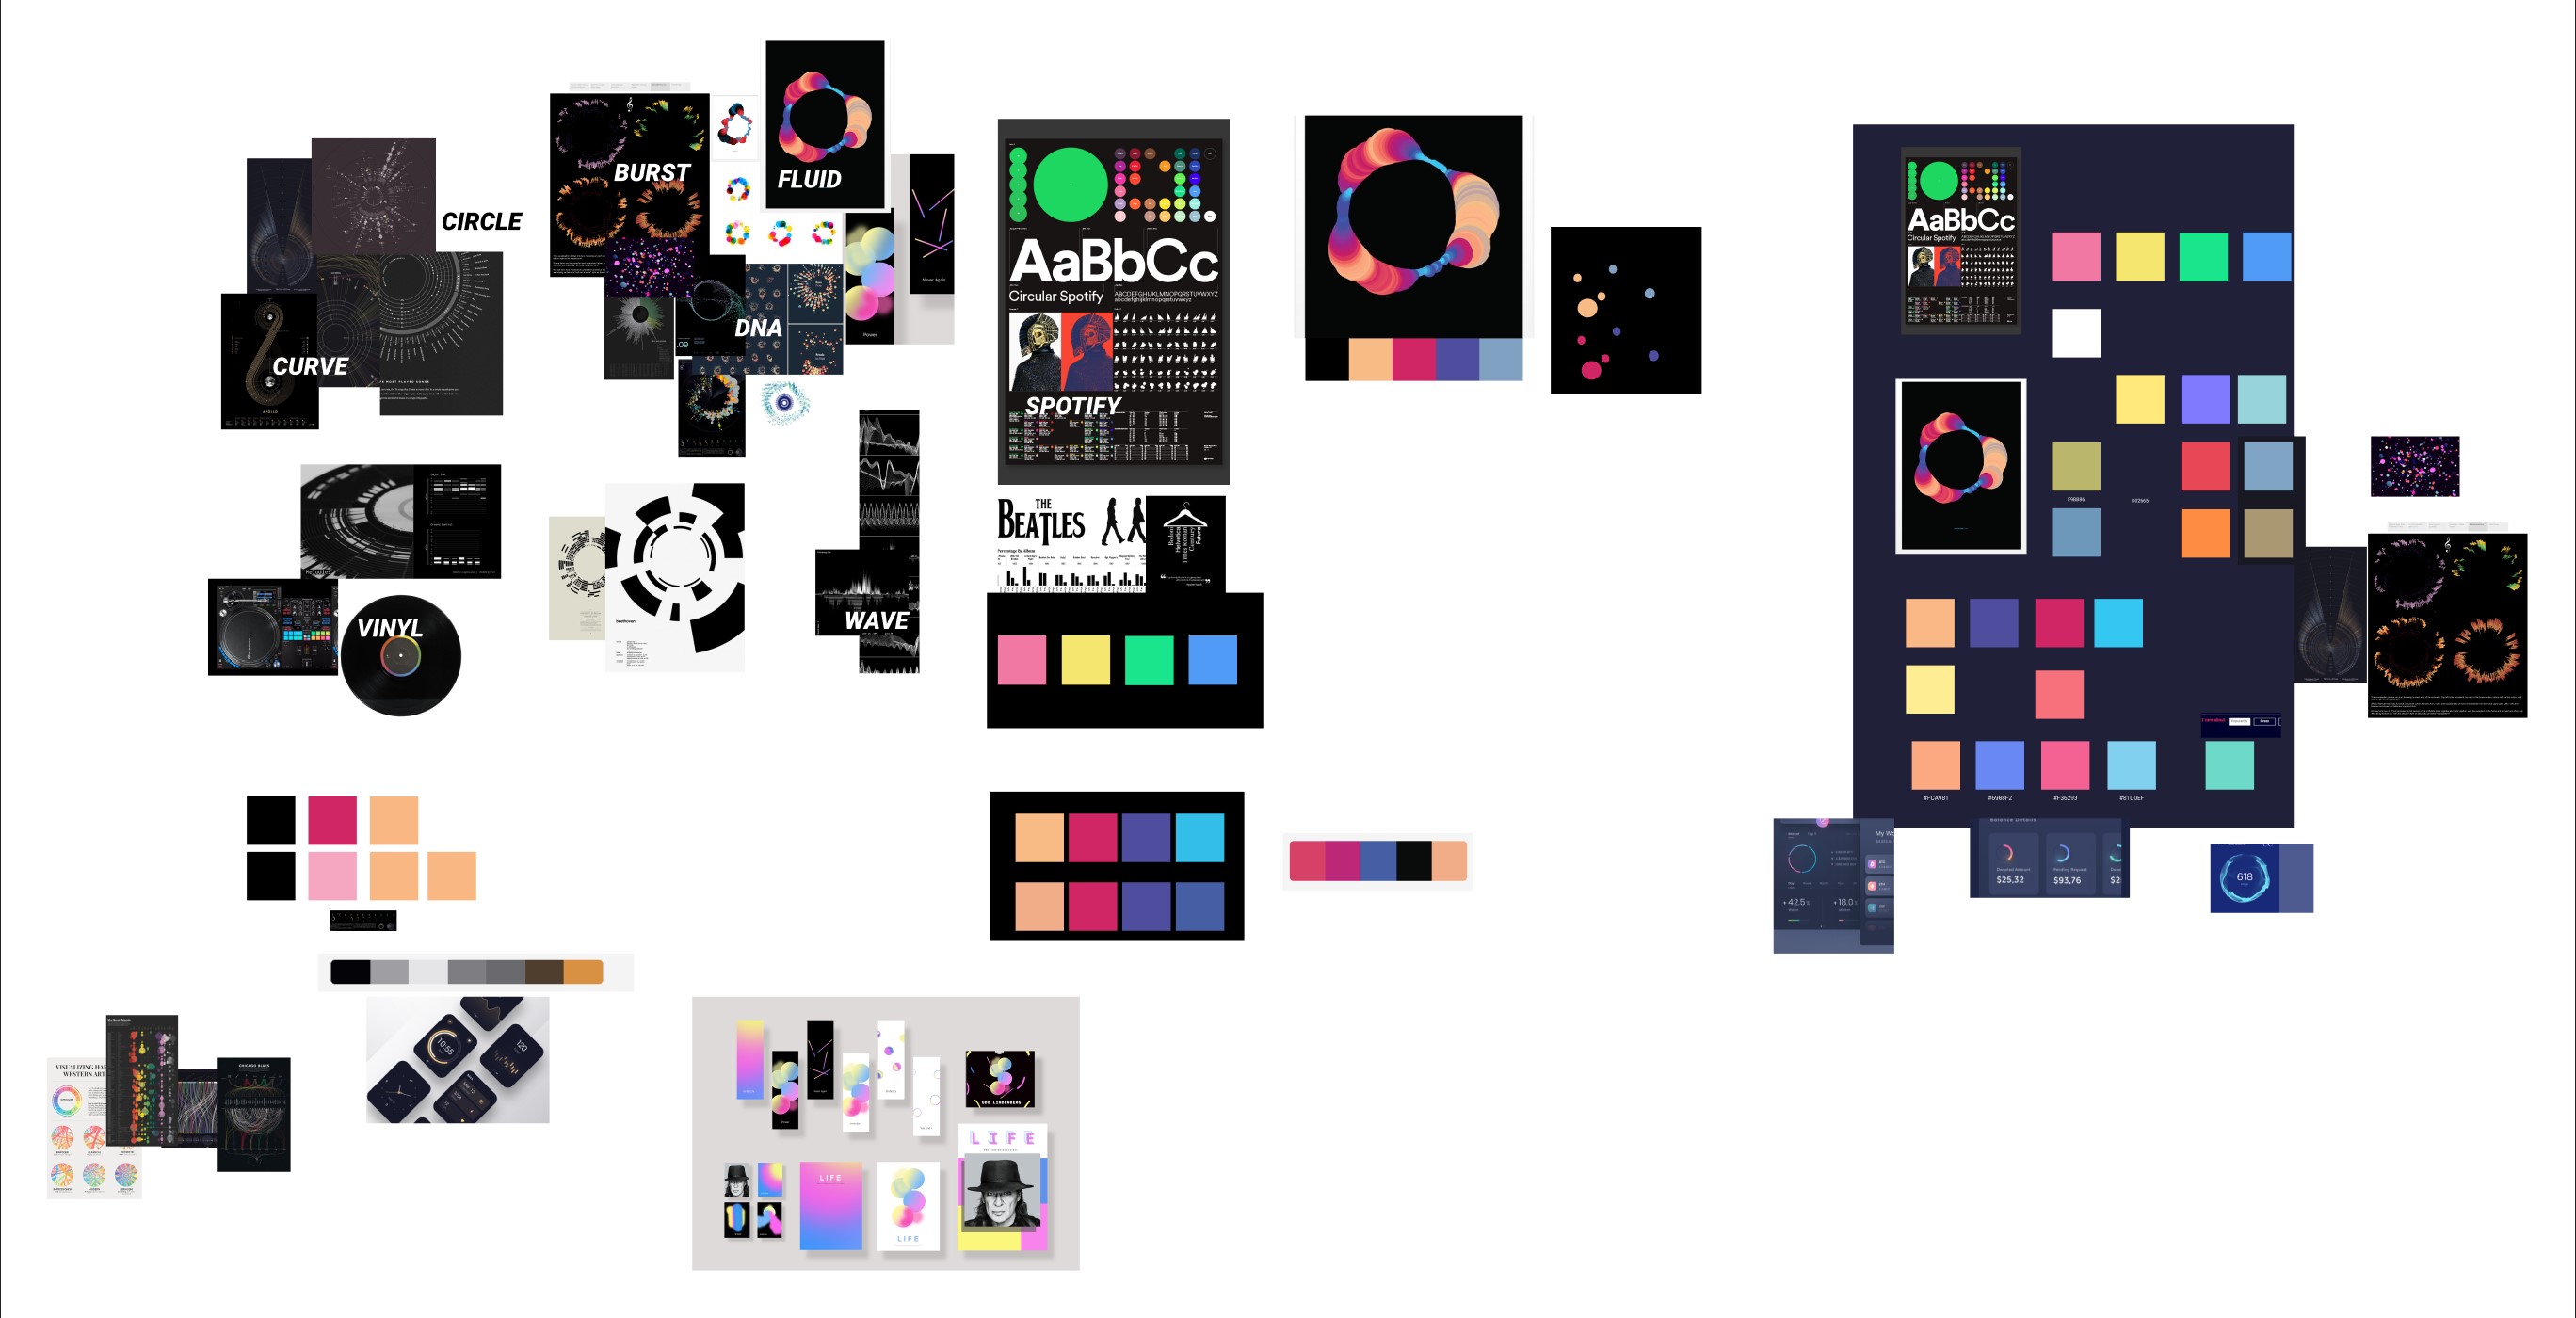
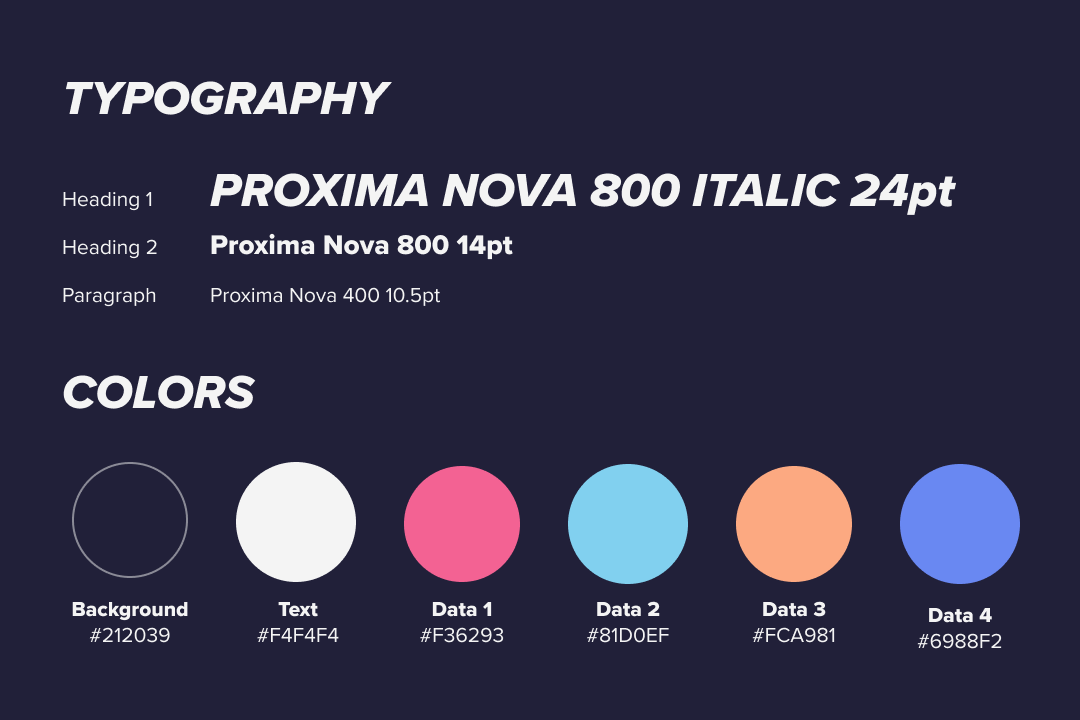
Visual Design
After the design became more mature, we started working on the visual design of the visualization. The goal was to make it look "trendy," "cool," "energetic," etc., to appeal to music lovers.
Prototype Development
We developed the prototype using D3.js. While prototyping, lower-level design decisions were made and microinteractions were added.
More Expert Feedback
We also gain more expert feedback regularly during development. They helped us fill gaps that were overlooked and those that could be improved.
Design Tweaks
These are the notable changes in the design during development. The changes were influenced either from expert feedback, internal testings, and informal comments from users.
- Given the multitude of attribute options for axes, provide users a "general grouping" option through techniques like Principle Component Analysis.
- Locations of controls UI were tested on multiple places such as around the circular graphic, on top of the page, and on the left.
- Adding a "split view" option to the design to help make the comparison clearer when a lot of data points are on the chart.
- Adding tooltips to explain musical terms for users with little music background as well as tutorials to guide the user through the visualization.
Mobile Version
Realizing that the project will also be used and shared through mobile devices, we decided to try to adapt our design to work on mobile devices with limited functionalities. We designed the page to be responsive to screen sizes to make the mobile experience more usable, with a message persuading users to try the visualization on a full computer for a richer experience.
User Testing
We conducted 5 informal usability testing sessions that lasted about 20-30 minutes each. The objective of the testing was to evaluate our design and find design flaws before finalizing the project as well as to make design decisions about the placement of some UI controls.
Results & Final Tweaks
Participants seemed to understand the tool quickly without much help and some of them referred to the visualization as "cool" and "interesting". Some participants with musical backgrounds even spent over half an hour playing with it after the session to explore their favorite music. Minor design errors and bugs, such as features being overlooked, tooltips being unintentionally skipped, data points accidentally deselected, were found and fixed by, for example, changing when tutorial tooltips appear, alter the copy writing, and tweaking the selection behavior.
Final Product
Publishing the Project
After all these design iterations, development, and testing, Vinyl was published to Reddit in the r/dataisbeautiful subreddit with over 14 million information visualization enthusiasts as members.
With that, we received highly positive responses from the users with almost 800 upvotes and over 3,500 users, and counting, visiting the visualization.
Click here to see the Reddit thread or visit kenziemurphy.github.io/vinyl/ to try Vinyl for yourself.
What’s Next?
The design and development attempts so far have been mostly focused on desktop-based experience. However, to appeal more to casual users, a mobile version is needed since it is easier to access. Even though this website also works on mobile, it still has limited functionalities compared to the desktop version. The future work for this project is to design the mobile experience that is more friendly to small touchscreens while keeping the powerful functionalities.
Acknowledgements
I would like to thank…
- Xi Chen, Benjamin Du Preez, McKenzie Murphy, our awesome team! Thanks to you all for your hard work.
- Dr. John Stasko, for valuable feedback and advice throughout the semester and for helping publish our project.
- Darsh Thakkar and Po Ming Law, for helpful feedback throughout the semester.
The schedule of the class project did not quite allow much extensive user research which would have made the design decisions stronger. However, this task-based approach helped us look at the project from a more user-centered perspective.